Q1 2020: No Place to Hide? Solactive Minimum Downside Volatility Indices in a Sell-Off Period
During the first quarter of 2020, capital markets got shaken up by a sharp rise in volatility as well as an unprecedentedly quick downturn in equities. It took the Solactive GBS Global Markets Large & Mid Cap USD Index 20 days and the Solactive US Large Cap Index 16 days to enter bear market territory (conventionally defined as a drop of 20% from peak) – the fastest sell-off pace ever.
We examine the performance of three Solactive Minimum Downside Volatility indices during 1Q20 and other periods. There weren’t many stock segments left immune during the past weeks, which is why these indices took a hit as well. However, they may provide more stability and downside protection in comparison to their benchmarks. Relative to minimum volatility strategies, Minimum Downside Volatility indices performed slightly worse or aligned to them during market downturns. However, during a longer timeframe, MDV indices’ performance was either better or similar to that of minimum volatility indices. Therefore, it may be implied that by minimizing only downside volatility, investors can protect themselves to a certain degree from market downturns without sacrificing too much upside potential during times of calm in the market.
Solactive Minimum Downside Volatility Indices – Reducing Downside, Allowing Upside
In a white paper from 2017, Solactive published a concept that is based on over 60-years-old research by Harry M. Markowitz. The idea – simple and very effective – is to focus on the part of volatility that investors really want to avoid when they aim to reduce volatility. Our Minimum Downside Volatility (MDV) strategy optimizes a portfolio by minimizing the downside volatility. As investors can most likely live with pure upside volatility, they should be interested in minimizing negative returns whenever they aim to reduce a portfolio’s volatility. Downside volatility is a risk measure that only takes returns below a given threshold – e.g. zero – into consideration. As a result of the optimization process, we get a portfolio that focuses intuitively on what investors really want to prevent. Please find more details as well as the technical background in our white paper with the title “Minimum Downside Volatility Indices”.
The concept is quite intuitive and very powerful, not only in reducing volatility, but also in achieving a better performance of an index in comparison to its benchmark. In this blogpost, we analyze the performance of MDV indices during the first quarter of 2020 and the sell-off period from Feb-12 until Mar-23, 2020, as well as in other turbulent periods within the last two years. To provide a bigger picture, we also look at their performance over a longer time period. The indices we analyze are the following. [Please check our website for more information about these indices.]
- Solactive All Country Minimum Downside Volatility GTR,
- Solactive Developed ex US Minimum Downside Volatility GTR, and
- Solactive US Large Cap Minimum Downside Volatility GTR,
as well as their respective benchmarks (Solactive GBS Global Markets Large & Mid Cap USD Index TR, Solactive GBS Developed Markets ex United States Large & Mid Cap USD Index TR, and Solactive US Large Cap Index (GTR)).
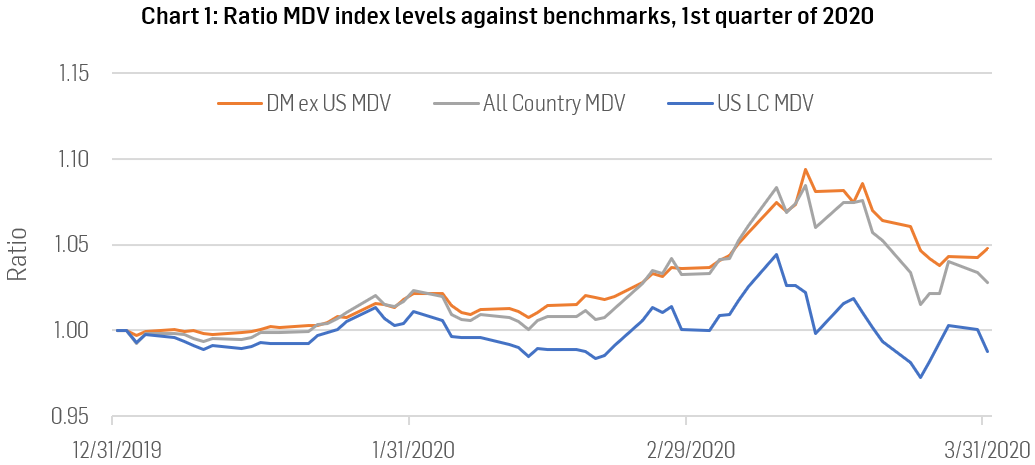
MDV – A Better Place to Hide During a Sell-Off
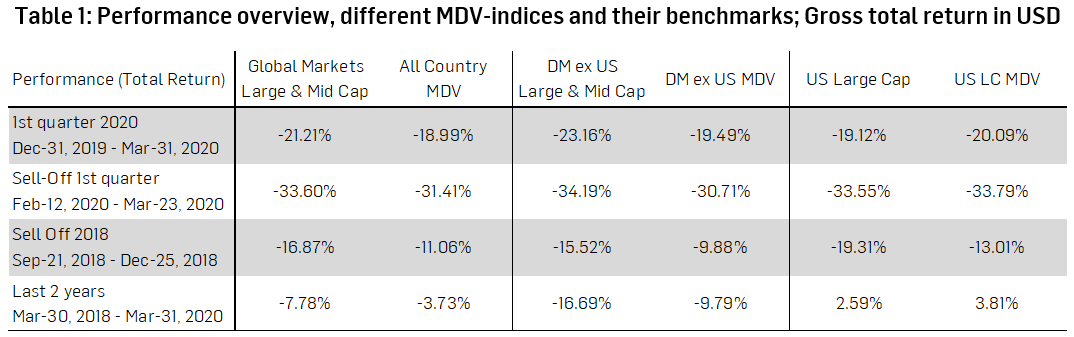
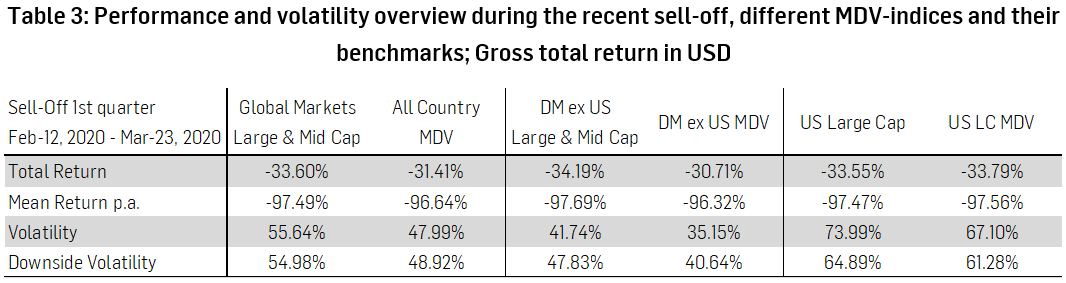
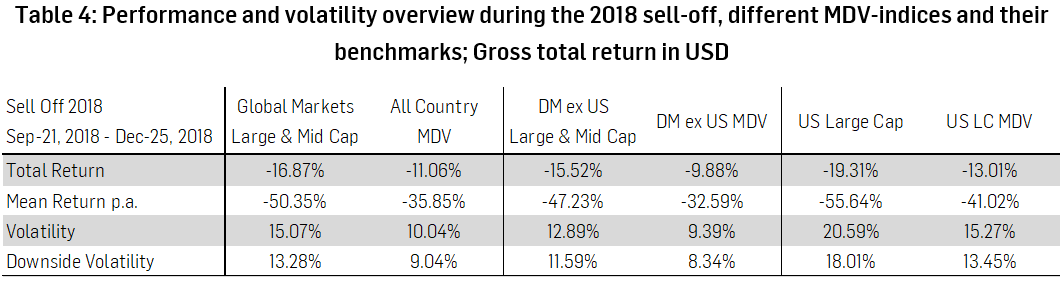
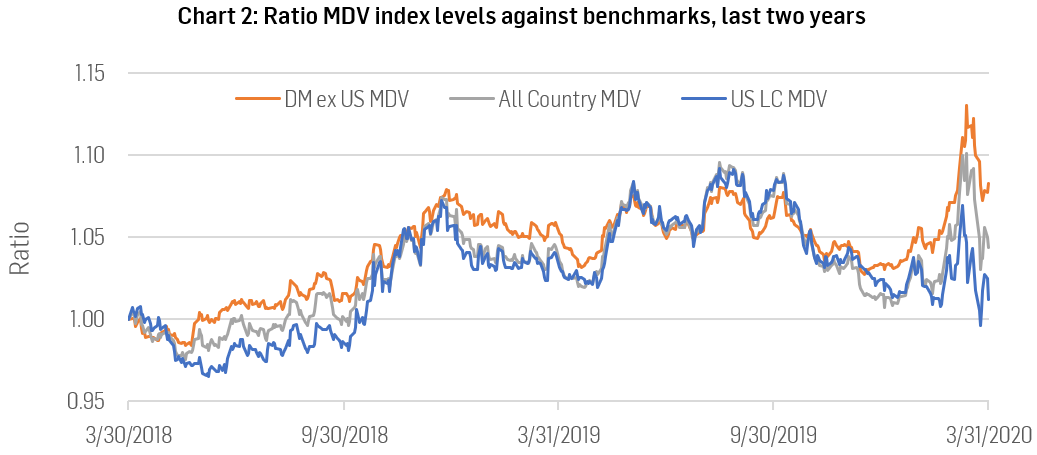
The current crisis around the coronavirus and the accompanying sell-off in the first quarter of 2020 were unprecedented, and we have all heard enough about spectacular new records around the speed of the downturn. During such a period there may not be any good place to hide in the equity world. However, indices constructed with our MDV-concept at least offered (on average) slightly better returns than the respective benchmark indices. As the recent sell-off did not spare many areas, our MDV-indices did not remain unaffected. To get a bigger picture of how the concept performed during downturns, we also look at the period until the end of 2018, during which the stock market stood at the brink of a bear market. Back then, the MDV-indices muddled through a period of downside volatility far better than their benchmarks. Table 1 provides a performance-overview of the above-mentioned indices during different timeframes.
MDV-Indices During Different Time Periods
We present performance and volatility figures for selected periods in order to provide insights into the results MDV-indices achieve. Turbulent times are especially interesting, as these have a large impact on overall performance numbers. If the MDV-strategies manage not to capture the same magnitude of a down movement as the market, while not being limited on the upside, an outperformance over a longer period may be the outcome.
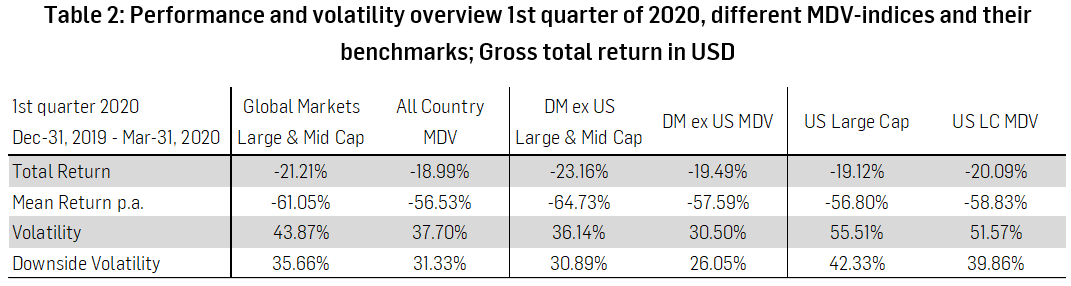
First Quarter of 2020: During the first quarter of 2020, the MDV-strategies outperformed their benchmarks, except for the US equity market, where the performance was almost in line with that of the market. Unsurprisingly, their overall volatility, as well as downside volatility, were lower than those of their benchmarks.
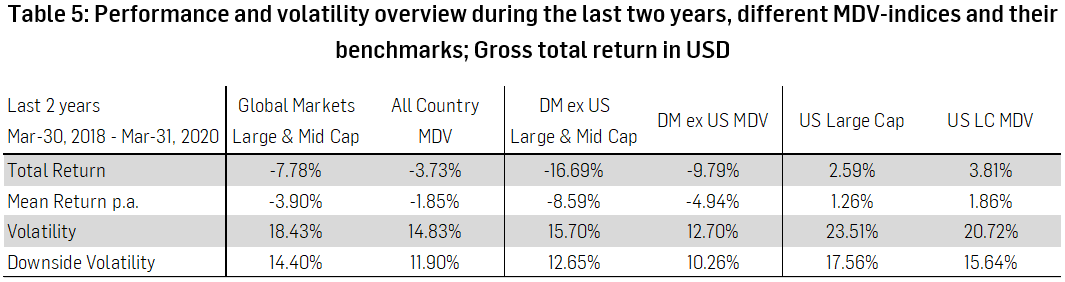
Long term: In a timeframe that includes the great financial crisis as well as the recent sell-off, the outperformance of MDV-strategies is noteworthy. From May 2006 until today, the Solactive GBS Developed Markets ex United States Large & Mid Cap USD Index returned 26.84%, and the Solactive US Large Cap Index yielded 162.86%. The respective MDV-strategies Solactive Developed ex US Minimum Downside Volatility and Solactive US Large Cap Minimum Downside Volatility outperformed these benchmarks by 69.20 and 37.34 percentage points with +96.04% and +200.20%, respectively. The broad Solactive All Country Minimum Downside Volatility had a total return of 173.17% during this period. Once more, volatility was lower for the MDV-strategies.
Performance relative to comparable strategies: During the two most recent market sell-offs (those of 2018 and 2020), the performance of MDV indices was slightly worse or aligned with that of comparable minimum volatility indices (which focus on minimizing the overall volatility of a portfolio). However, over a longer time frame from May 2006 until the end of Q1 2020, MDV indices’ performance was either better or similar to that of minimum volatility indices. Therefore, it may be implied that by minimizing only downside volatility, investors can protect themselves to certain degree from market downturns without sacrificing too much upside potential during times of calm or bull markets.
Charts: Slightly Better Picture for the MDV-Indices
Final Remarks
For some equity indices, the first quarter of 2020 was the worst first quarter ever. Obviously, as the above shows, our MDV-indices were just a slightly better place to hide. To get a better understanding of how MDV performs, we present a bigger picture and examine other turbulent market phases as well as a longer time period. What we observe from the ex-post performance analyses is that the MDV-strategies deliver a reduced volatility during a downturn. At the same time, they do not seem to give up on the upside, although the US-version underperforms in a bull market environment. This combination – not taking the full downswing while holding up well on the way up – yields to an outperformance over a time period that includes crises, bear markets, recoveries, and bull markets. Hence, if we regard a timeframe that is long enough to include turbulent periods, e.g. May-2006 until today, the magic of the simple but very powerful MDV-approach becomes visible. Going forward, as the nature of capital markets will most likely not change with times of significantly elevated volatility and times of muted and stable volatility, our Minimum Downside Volatility concept offers investors some protection on the downside while trying to capture enough upside to outperform a given benchmark. Especially in time horizons that go through one or more regime shifts in which the volatility levels change materially, the MDV-strategy may perform well in comparison to the broad equity market.
Dr. Axel Haus, Team Head Qualitative Research
Solactive AG