Diversification – The Power of Bonds
EXECUTIVE SUMMARY
In this blog post, we construct a simple two-asset portfolio, including Solactive’s GBS Developed Markets Large & Mid Cap USD TR Index and Solactive’s USD EM Government & Govt Related TR Index. While on an absolute basis, the equity-only portfolio still outperforms the multi-asset portfolio, we are able to show the benefits of diversification on a risk-adjusted basis. To demonstrate this, we use a technique called volatility scaling. We simulate the wealth evolution of the equity-only and multi-asset portfolio while matching the volatility of both portfolios.
TECHNICAL BACKGROUND
Diversification is the fundamental concept of modern portfolio theory. The Idea can be traced back to Harry Markowitz and his seminal paper “Portfolio Selection” in the Journal of Finance in 1952. Since Harry Markowitz introduced covariance as an additional parameter to the expected return and expected volatility, we can discriminate between efficient and inefficient multi-security portfolios. A portfolio is considered to be efficient if there is no other multi-asset portfolio within the universe, which produces a higher return given the level of risk or is able to provide the same return with a lower level of risk.
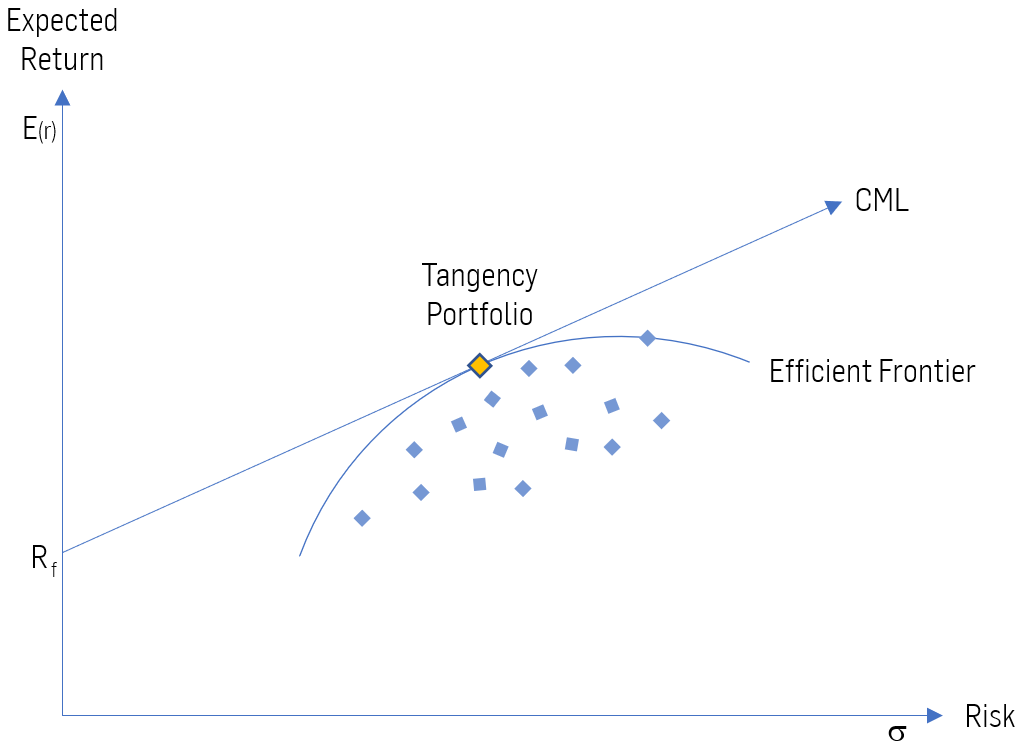 Figure 1: Efficient Frontier, for illustrative purposes only. Source: Solactive
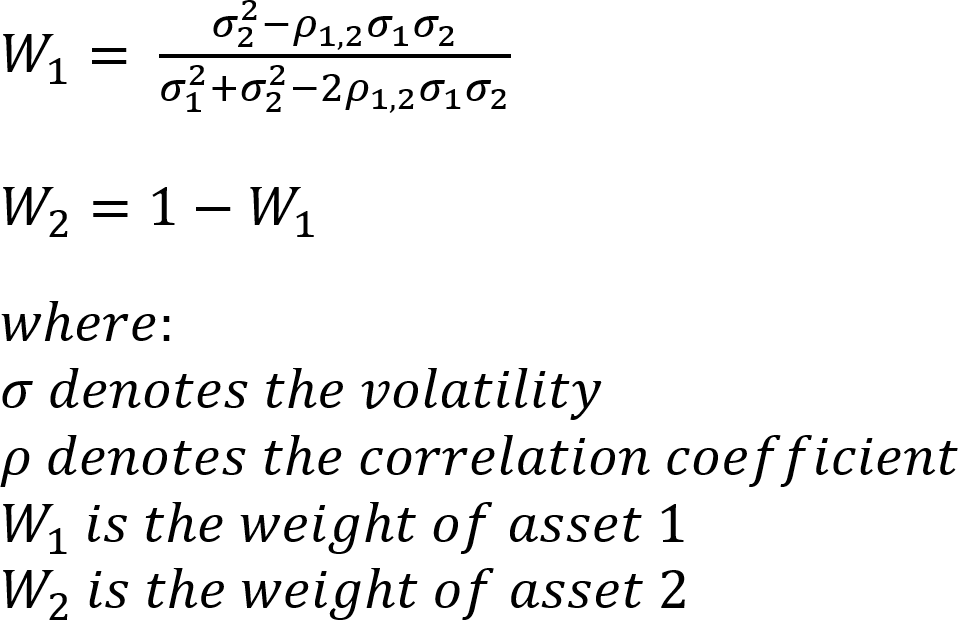
We plotted the efficient frontier in the figure above. The blue squares denote all kinds of inefficient portfolios. Modern portfolio theory found a mathematical formula, which allows investors to calculate the weights of each security to form the minimum variance portfolio. To calculate these weights, an investor only needs the expected variance and the covariance of the assets within the universe. For a two-security portfolio, one can calculate the weights to achieve the minimum variance portfolio as follows:
In the following case study, we examine whether we can achieve significant diversification effects by constructing a two-asset class portfolio based on emerging markets hard currency government bonds and a developed markets equity portfolio.
|
Diversification reduces the exposure to any one particular risk of an asset class or single investment |
CASE STUDY: EM BONDS & DM STOCKS
As discussed before, rational asset allocation should not only be based on the risk / return profiles of the single investments but the risk and return properties of the combined portfolio. In our case study, we use the Solactive GBS Developed Markets Large & Mid Cap USD Index TR as our equity portfolio and the Solactive USD EM Government & Govt Related TR Index as our fixed income portfolio. While the equity portfolio is subject to currency risk, the underlying bonds in the bond portfolio are all denominated in USD. The equity portfolio has had a good run and returned around 80% in the examined period between July 2013 and July 2019. In the same period, the emerging markets fixed income portfolio showed a return of approx. 43%.
To evaluate the risk of a portfolio, one typically uses the volatility metric of the portfolio. Volatility is a measure of variation; it indicates how much single values of a dataset deviate from its mean. Within modern finance, volatility represents the most noted metric to measure risk. Assets with a higher return or price volatility are considered riskier than assets with low volatility.
In the following table, we show the monthly returns of a hypothetical high and low volatility stock. Both assets have the same average return over the course of the year, however returns of the high volatility asset vary by a much greater degree than the returns of the low volatility asset, thus making the returns of the high volatility asset much more uncertain and therefore riskier.
|
|
Low Volatility Asset |
High Volatility Asset |
|
January |
3% |
15% |
|
February |
4% |
-10% |
|
March |
2% |
20% |
|
April |
3% |
0% |
|
May |
3% |
-20% |
|
June |
2% |
25% |
|
July |
1% |
10% |
|
August |
5% |
15% |
|
September |
3% |
-10% |
|
October |
2% |
2% |
|
November |
1% |
1% |
|
December |
3% |
-10% |
|
Average Return |
3% |
3% |
|
Volatility of Returns |
1.2% |
14.0% |
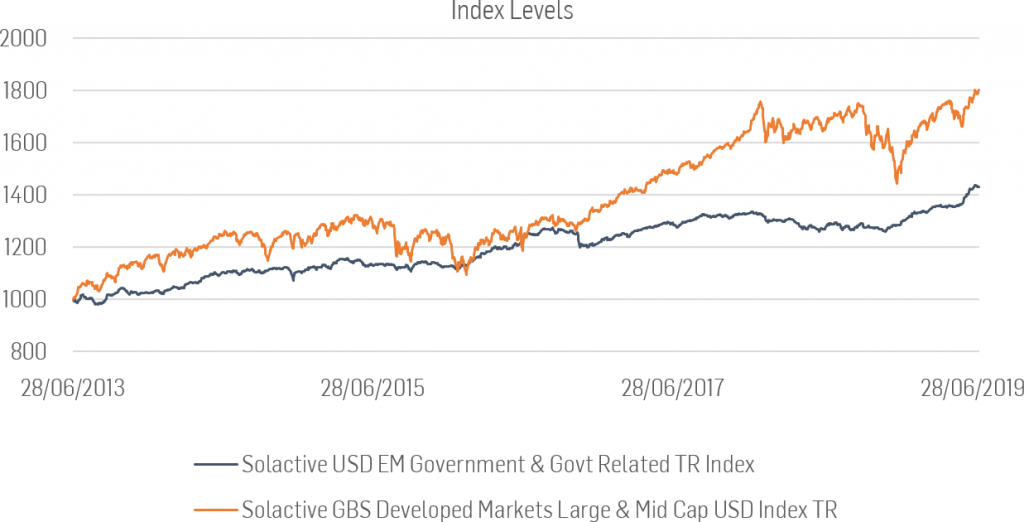
Figure 2: Index Levels for Solactive USD EM Government & Govt Related TR Index and Solactive GBS Developed Markets Large & Mid Cap USD Index TR
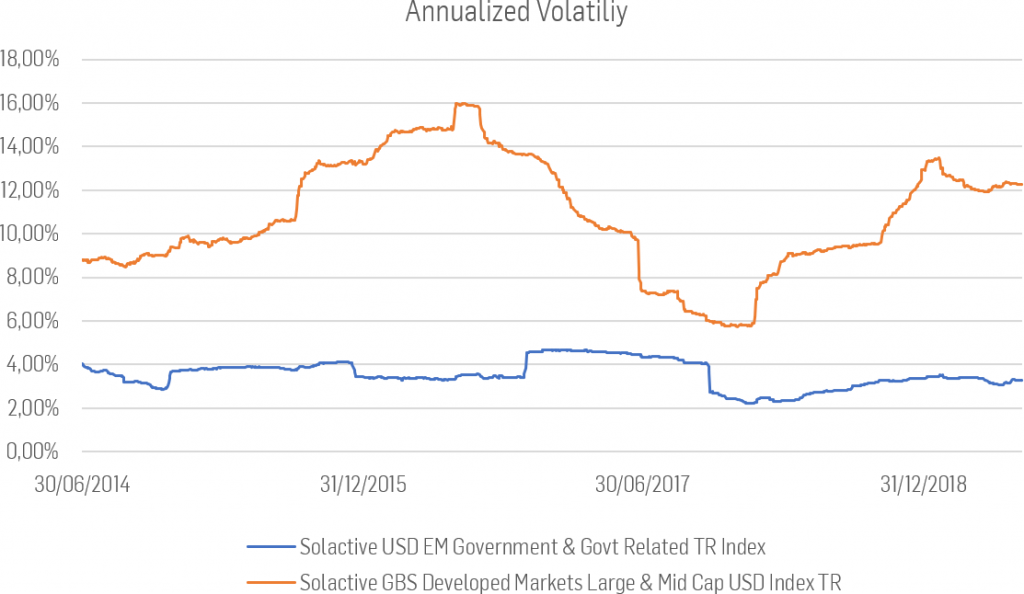
In this exercise, we approximate the risk of a portfolio by utilizing the average volatility of daily returns for the past 12 months. As expected, the daily return volatility of the fixed income portfolio is lower than the volatility of the equity portfolio. The expected return is approximated by the average daily return of each portfolio, calculated using an expanding lookback window.
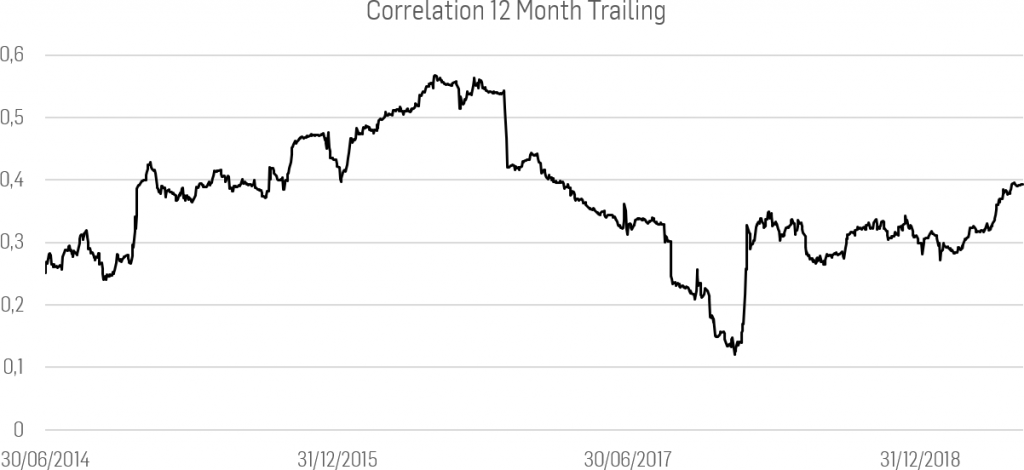
The third parameter set for an optimal multi-asset portfolio is the correlation between the assets. As a proxy for the expected correlation, we use the trailing correlation of the past 12 months.
THE OPTIMAL PORTFOLIO
While the optimal portfolio generally depends on personal risk and return preferences / tolerances of an investor, we chose a relatively straightforward Sharpe Ratio maximization function. In this blog, we set the weights of our bond and equity portfolio in such a fashion that we maximize the following function:

- The weight of the equity portfolio and fixed income portfolio have to add up to 100%.
- The minimum weight of the bond portfolio is 1%.
- The maximum weight of the bond portfolio is capped at 99%.
- The multi-asset portfolio is not rebalanced to its target weights during the year. Weights are only reset to the new optimal weights at the last business day of June.
As the expected return and expected volatility depend on past daily returns, we need to jump-start our model in the first year and set the weights arbitrarily. On the start of our simulation, we chose the weights in the bond portfolio to be 50% and, thus, the equity portfolio received an initial weight of 50% as well.
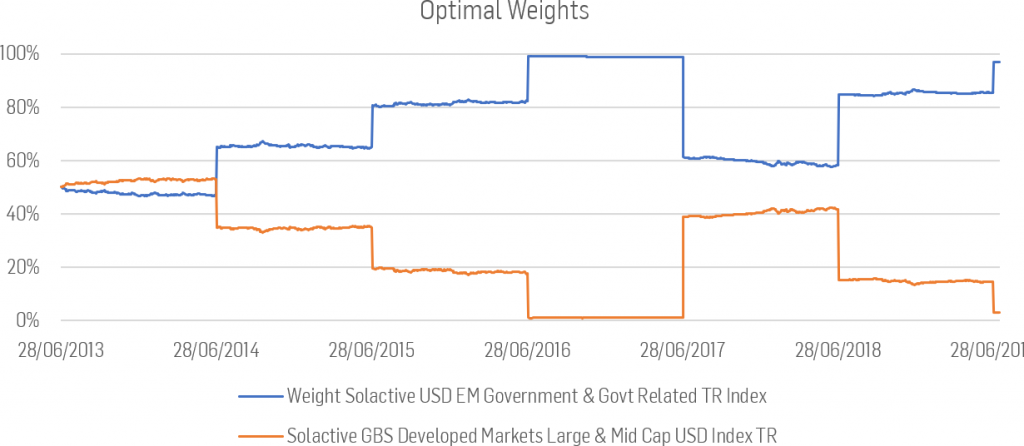
Finally, we can construct our optimal portfolio and plot its performance against both the all-stock and the all-bond sub-portfolios.
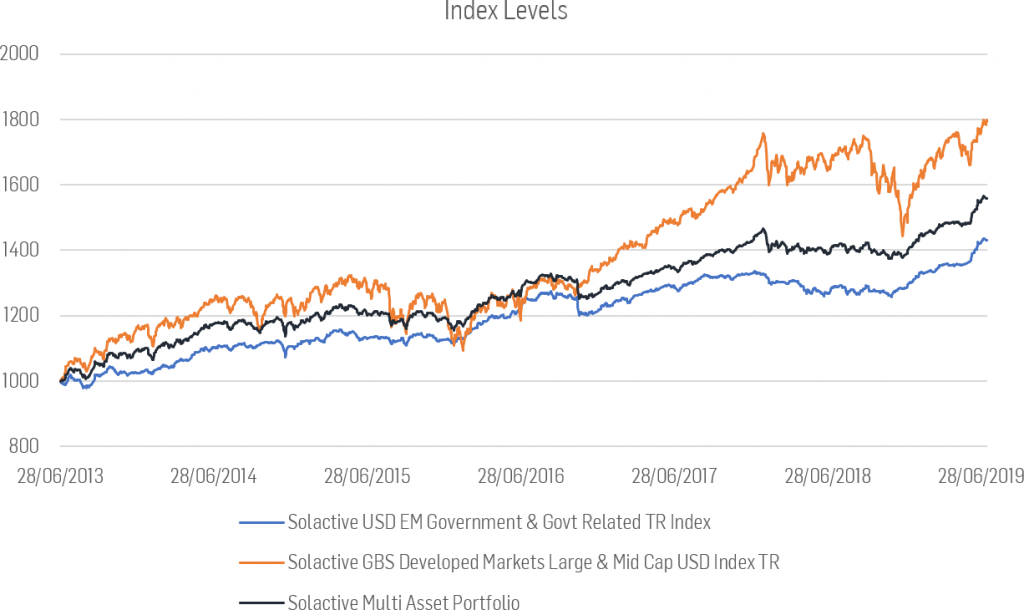
Looking at returns alone, the multi-asset portfolio performed worse than the equity portfolio but better than the fixed income portfolio. However, we still can see that the risk level of the equity portfolio is larger than the one of the multi-asset and fixed income portfolios. To make the equity portfolio more comparable to the multi-asset portfolio, we use a technique called volatility scaling. Volatility scaling or volatility targeting is a technique where one mixes a risky asset with a zero-volatility asset in such proportions that the volatility of the combined portfolio reaches the desired level. We match the volatility of the equity portfolio with the volatility of the multi-asset portfolio. Once we controlled for risk, the returns of the two portfolios are comparable, and we can judge, which portfolio performed better on a risk-adjusted basis.
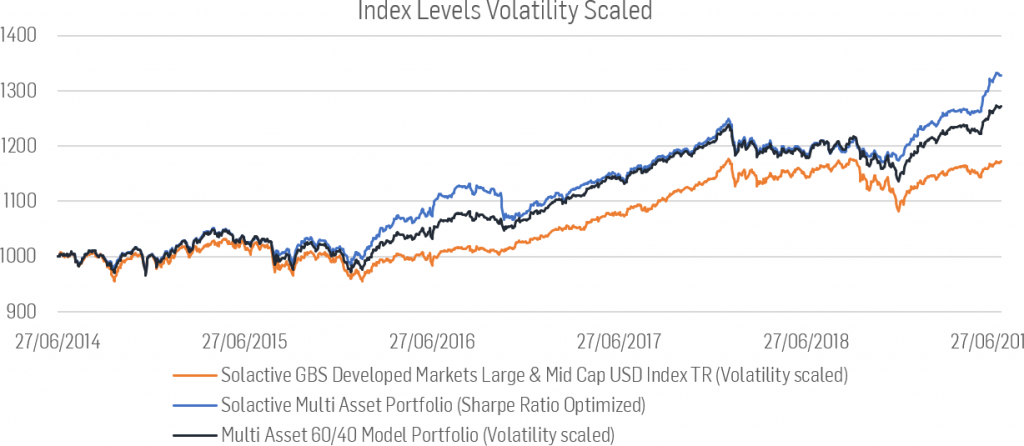
Figure 7: Index Levels Volatility Scaled, the Solactive GBS Developed Markets Large & Mid Cap USD Index TR timeseries is scaled to match the volatility of the Solactive Multi Asset Portfolio timeseries
CONCLUSION
The chart above lets us conclude that the comparatively simple constructed multi-asset portfolio consisting of emerging market government bonds and developed market equities manages to outperform the equity portfolio, reflecting the benefits of adding bonds into a pure equity portfolio. For illustrative purposes, we have also included a traditional multi-asset model portfolio using a 60/40 split (60% Solactive USD EM Government & Govt Related TR Index and 40% Solactive GBS Developed Markets Large & Mid Cap USD Index TR). Even more important, we can demonstrate the benefits of diversification. Diversification has come under attack after the great financial crisis when correlations between different assets approached high levels and, as a consequence, major assets classes moved closer together. While we acknowledge correlations between assets are non-static, they are far from approaching 1 in times of distress. This fact can be observed between October 2018 and January 2019, especially, after equity markets came under pressure and a diversified portfolio in stocks and bonds was able to absorb this downturn.
Sebastian Alber
Fixed Income Product Development
Solactive
