Resurrection of the Historic Silk Road: Belt and Road Index Concept
With the Belt and Road Initiative, China introduced a massive infrastructure strategy that will most likely enhance regional connectivity and trade to a large extent. The initiative is a long-term project planned to be completed in 2049, with expected sustainable economic advantages for the countries along the “Belt” and the “Road”. In order to capture the benefits derived from this project, we have developed our Solactive Belt and Road Index Concept. Its constituents take advantage of their relatively large degree of revenue exposure to the Belt and Road Initiative’s corridor economies, and therefore of their expected fast rate of economic growth.
RESURRECTION OF THE HISTORIC SILK ROAD
Over the span of multiple centuries, a significant portion of maritime and terrestrial global trade took place along the Silk Road. On the one hand, Western Countries received goods such as silk, spices, gunpowder, and perfumes. On the other hand, gold, silver, horses, and textiles were shipped far east. 1
In October 2013 – almost 300 years after the downfall of the Safavid Empire caused the road’s collapse 2 – Chinese President Xi Jinping announced the launch of the Belt and Road Initiative (BRI), a global development strategy of gargantuan proportions. Fast-forward six years and his plan to emulate the Silk Road’s historical prominence has become his signature foreign policy project. The “Belt” would link countries from China to Europe via land, whereas Southeast Asian, Gulf, Eastern and Northern African, and European countries would be connected with maritime routes composing the “Road”. 3
The scope of the project is such that its routes and pipelines would connect countries that combined add up to over 4 billion inhabitants and more than a third of the world’s total gross domestic product (GDP). 4 China’s interest in developing a project of such scale may not only lie in reducing its exports’ and imports’ costs, but also in benefiting from better access to new markets and trading partners. 1
Even though some developments in countries such as Malaysia, Myanmar, Thailand, Laos, and Indonesia have raised issues regarding the initiative, ASEAN member states appear not to have a negative view in general of the overall project. Rather, they look forward to the breadth of infrastructure development and connectivity it entails, as well as to the rippling effects its investments would generate in their economy. 4
Indeed, it is expected that Chinese foreign direct investment (FDI) on One Belt One Road (OBOR) projects will total over USD 1 trillion over the course of the following decade (or 100 billion USD annually, on average), surpassing the annual combined GDP of Thailand, Malaysia, and Vietnam. This amount overshadows the historical average annual Chinese FDI. 1
Chinese FDI Outflow Relative to the World’s Total FDI Outflow Before and After Launch of Belt and Road Initiative (5 Year Moving Average)
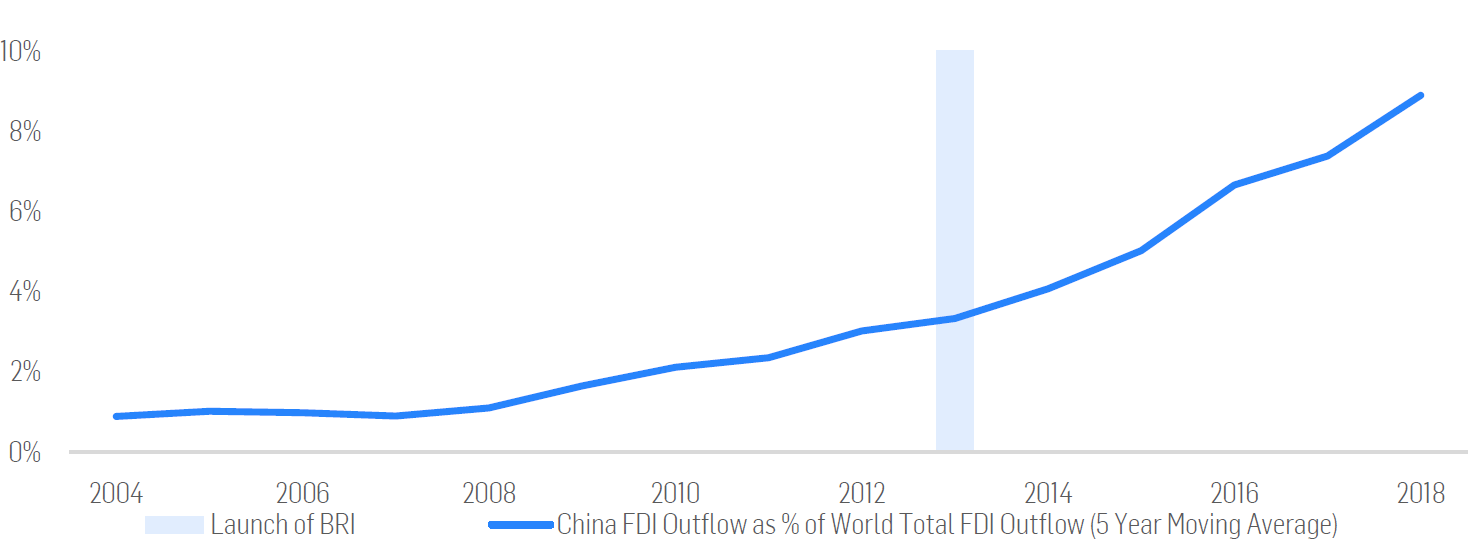
Source: Solactive and the World Bank
THE BELT ROAD INITIATIVE AS A FORESEEABLE SUCCESS STORY
The appeal of OBOR-related investments to prospective recipients may be magnified given success stories such as that of the Piraeus harbor in Greece. In 2010, it was the 93rd largest container port in the world, whereas, by 2018, it was ranked on the 30th place. 5 6 The improvement in cargo volumes took place after the acquisition of the port by COSCO Shipping (a Chinese company), which recently agreed to further invest about 660 million USD in the port in order to boost its operations. 7
Current initiatives are set to improve its beneficiaries’ economic outlook. For instance, projects such as the construction of a nationwide transportation network in Myanmar or the development of the Yunnan-Laos-Thailand cooperation zone are expected to increase the wealth of these regions. Other ones may even change the dynamics of the world economy. Such a possibility can arise via a Chinese-Saudi Arabian cooperation, which could provide the former a strategical location to access African and Central Asian markets, whereas the latter would benefit from capital and expertise to diversify its economy away from oil. 8
According to the World Bank, infrastructure projects enabled by the Belt and Road Initiative could reduce travel times for economies along transport corridors by up to 12%, reducing trade costs. Furthermore, they expect these projects to increase trade by between 2.8 and 9.7 percent for corridor economies, increasing global real income by 0.7 to 2.9 percent in the process (not including the cost of infrastructure investment). 3
THE SOLACTIVE BELT AND ROAD INDEX CONCEPT
Leveraging this set of facts, we have decided to create the Solactive Belt and Road Index Concept. We include companies that we expect to benefit the most from the far-reaching first- and second-order effects the initiative could generate across its 71 corridor economies – as identified by the World Bank. 3
Belt and Road Initiative Corridor Economies (Shaded in Blue)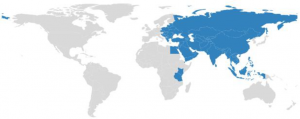
Source: Solactive and the World Bank
BRI corridor economies are among the fastest-growing ones in the world. According to International Monetary Fund (IMF) data, this set of countries’ constant price purchasing-power-parity (PPP) GDP surpassed that of the rest of the world by the end of 2018. This trend is not expected to stop. BRI corridor economies’ year-on-year (Y-o-Y) constant price PPP GDP growth rate is expected to be over 3 percentage points higher than the rest of the world’s one between 2019 and 2024.
BRI Corridor Economies and Rest of the World’s Constant Price PPP GDP (Billion International Dollars) (left axis) and BRI Corridor Economies and Rest of the World’s Constant Price PPP Y-o-Y GDP Growth Rate (Historical and Estimated Values)
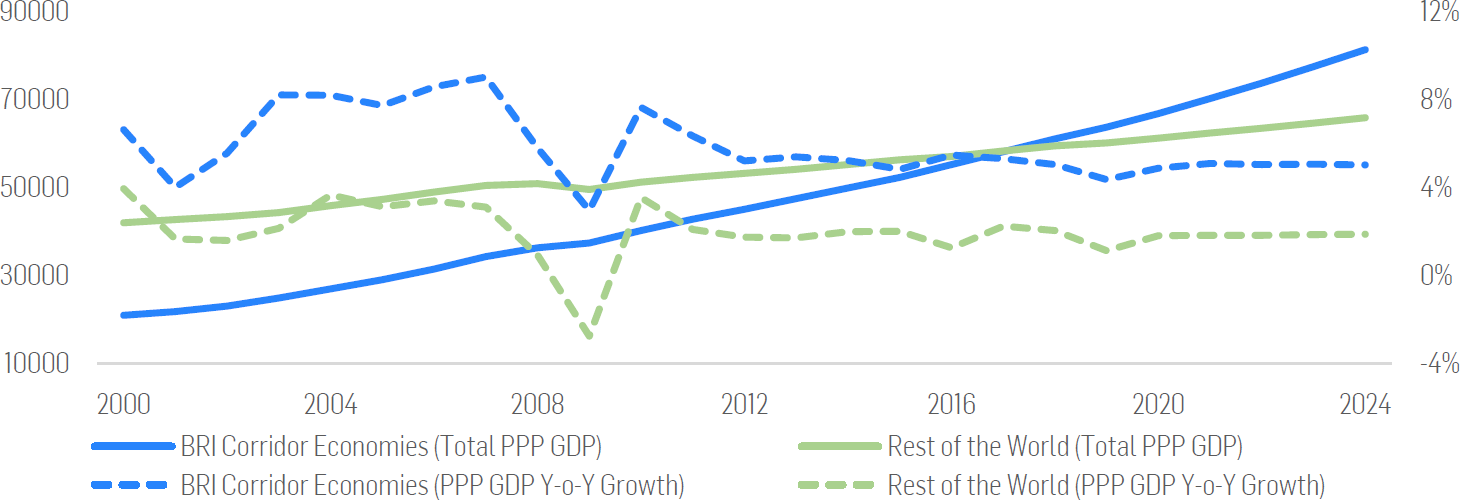
Source: Solactive and the International Monetary Fund
We select companies that perceive at least half of their total revenue from the Belt and Road Initiative’s corridor economies and generate revenue in at least five of these countries at the same time. Additionally, the index constituents must be amongst the top-100 companies relative to their geographic revenue diversification. We measure the companies’ degree of revenue diversification by their geographic revenue’s Herfindahl-Hirschman Index (HHI). This measure is given by the square root of the sum of squares of the companies’ revenue share in a particular region. A lower HHI indicates a greater degree of geographic diversification. 9 The Belt and Road Index constituents are weighted according to their security-level market capitalization. The index is rebalanced on an annual basis and excludes Chinese A-shares.
HISTORICAL PERFORMANCE ANALYSIS
The Solactive Belt and Road Index is expected to benefit from the Belt and Road corridor economies’ increasing relevance within the global financial ecosystem. Based on a historical simulation from October 2014 until November 2019, the index would have delivered a total return of around 33% – translating to an almost 6% annualized return. Thus, it would have underperformed the global stock market but outperformed broad emerging markets stocks. It experienced its largest drawdown between May 2015 and February 2016, a timeframe that coincides with turbulences in the Chinese stock market and its spillovers to global equities. During the time period of our study, the index’s annualized volatility was 12.54%.
Historical Total Return of the Belt and Road Index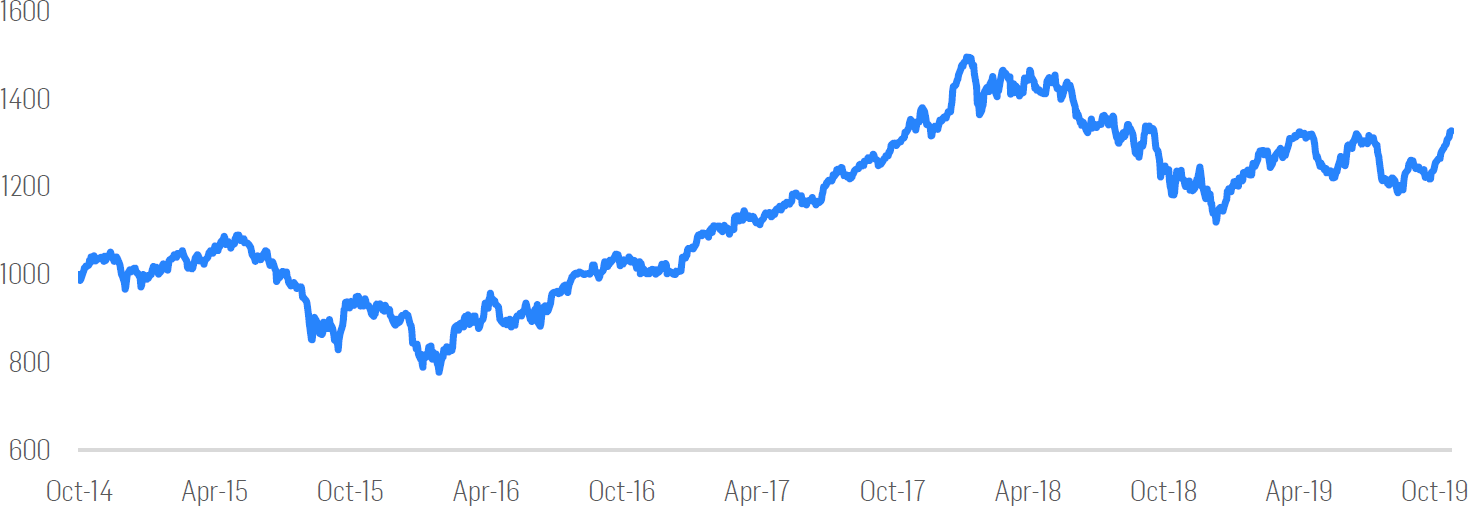
Source: Solactive
As of its latest rebalance (in October 2019), over half of the index’s weight is allocated to companies with primary listings in Japan, the United States, and Singapore. On the other hand, over two-thirds of its weight is in companies that compose the Industrials, Technology, and Financial sectors. Four companies, in particular, represent over a fourth of the index’s weight. These companies are Philip Morris International, AIA Group, Saudi Basic Industries, and Rosneft Oil.
Top-10 Markets of Primary Listing, Sectors, and Index Constituents of the Belt and Road Index (as of October 2019’s Rebalance)
| Market of Primary Listing | % | Sector | % | Index Constituent | % | ||
| Japan | 27,0 | Industrials | 30,4 | Philip Morris International | 8,6 | ||
| United States | 18,4 | Technology | 19,0 | AIA Group Limited | 8,2 | ||
| Singapore | 13,5 | Finance | 17,9 | Saudi Basic Industries | 5,3 | ||
| Hong Kong | 8,8 | Consumer Non-Durables | 11,1 | Rosneft Oil | 4,9 | ||
| Saudi Arabia | 5,5 | Energy | 8,2 | Nidec Corporation | 2,9 | ||
| Russia | 4,9 | Healthcare | 4,5 | Jardine Matheson Holdings | 2,9 | ||
| Taiwan | 4,2 | Consumer Durables | 3,8 | Daikin Industries | 2,8 | ||
| Malaysia | 3,4 | Basic Materials | 3,3 | Fanuc Corporation | 2,7 | ||
| Thailand | 2,8 | Consumer Services | 1,8 | Oversea-Chinese Banking Corporation | 2,4 | ||
| Australia | 2,5 | Utilities | 0,0 | Jardine Strategic Holdings | 2,4 |
Source: Solactive
FINAL REMARKS
China is reviving the historic Silk Road and stock investors, can benefit from the project’s long-term exciting developments ahead. Given the ever-growing importance Belt and Road Initiative’s corridor economies will have in the shaping of society within the foreseeable future, companies that broadly service their markets should be at the center of investors’ attention. The Belt and Road Index Concept provides the opportunity to gain exposure to this set of companies. In doing so, investors can profit from exposure to some of the fastest-growing economies in the world.
References
[1] de Laubier, Burfeind, Zhou, Xie, Heck, and Siegrist, “The Trillion-Dollar Plan for the New Silk Road”
https://www.bcg.com/publications/2018/trillion-dollar-plan-new-silk-road.aspx
[2] Faroqhi, and Suraiya, “Crisis and Change, 1590–1699”
[3] The World Bank Group, “Belt and Road Economics: Opportunities and Risks of Transport Corridors”
https://openknowledge.worldbank.org/bitstream/handle/10986/31878/9781464813924.pdf
[4] Cox, Jie, Yan, Jusoh, Hamzah, Casarini, Loong, Tay, and Pongsudhirak, “China’s Belt and Road Initiative (BRI) and Southeast Asia”
http://www.lse.ac.uk/ideas/Assets/Documents/reports/LSE-IDEAS-China-SEA-BRI.pdf
[5] Kynge, “A Tale of Two Harbours Tells Best and Worst of China’s ‘Belt and Road’”
https://www.ft.com/content/7699d13a-806a-11e8-af48-190d103e32a4
[6] World Shipping Council, “Top 50 World Container Ports”
http://www.worldshipping.org/about-the-industry/global-trade/top-50-world-container-ports
[7] Georgiopoulos, Koutantou, and Maltezou, “China, Greece Agree to Push Ahead with COSCO’s Piraeus Port investment”
[8] Woetzel, Lin, Seong, Madgavkar, and Lund, “China’s Role in the Next Phase of Globalization”
[9] Pfeiffer, Agrawal, and Colin, “The Big Question: Diversify or not to Diversify? – Geographic Revenue Exposure”