Cash Matters: Introducing the Solactive Cashflow Kings Index Concept
|
The basic idea of the Solactive Cashflow Kings Index Concept is to identify companies with a strong and growing net operating cashflow that do not base their growth on an increasing capital intensity or an overburden of debt. The detection of such companies can lead to superior returns for investors. Whereas an outperformance of the Solactive Cashflow Kings Index Concept in the timeframe of an over one decade long bull market may not surprise ex post, the performance during the recent COVID-19-induced sell-off is compelling. |
Organic Cashflow Growth is King
The Solactive Cashflow Kings Index Strategy is comprised of stocks from the fastest-growing companies. Companies that are already growing their cashflow at a high pace, and at the same time, are outgrowing other companies, likely have a chance to continue their success story. The dynamic could be based on strong franchises, a superior market position with high barriers to entry, exceptional management, or on other reasons. However, as it could be possible to just grow the absolute cashflow figure by investing heavily, acquiring assets, or building up leverage, we take the total asset growth as well as the leverage ratio into consideration in the selection. We aim at constructing an index with companies that organically grow their cashflow.
Index Methodology and Selection Criteria
We focus on net operating cashflow growth and take only companies with a recent annual growth of more than 10% into consideration. We use quarterly reported cashflow figures and build an average over the last four quarters. This number is then compared with period of one year earlier. At the same time, we exclude highly leveraged companies as well as those that grow their total assets at a faster pace than their net operating cashflow. Companies are only eligible if they fulfill the cashflow growth criteria and have a total debt to total assets ratio of below 35%. Further, the average quarterly growth of the net operating cashflow to total assets ratio must be positive over the last eight quarters. On top of these criteria, we only take the top 70% of companies in terms of the net operating cashflow to total assets ratio.
We then rank the resulting companies according to their growth of net operating cashflow in the recent annual period, in descending order. The top 30 companies are weighted according to their free float market capitalization with a maximum weight cap at 10% for each stock. To control the turnover, a buffer rule applies. If a company is already in the index, it will only be excluded if it does not fulfill the selection criteria anymore, regardless of its rank. In a second version of the index, we apply an alternative weighting scheme, in which we weigh the companies according to their inverse volatility. The reason for this inverse-vol-weighted approach is a potentially high stock price volatility of fast-growing companies.
We have constructed two versions of the index (free float mcap weighted and inverse volatility weighted), each version covering two regions, based on individual benchmarks. The underlying benchmark indices are Solactive GBS Developed Markets Large & Mid Cap USD Index for broad developed markets equities, and Solactive GBS Developed Markets Europe Large & Mid Cap EUR Index for European equities. The Solactive Cashflow Kings Indices are rebalanced quarterly, and the index currency is US-Dollar for the global version, and Euro for the European version.
Thus, the selection criteria and index rules are:
- Growth of average annual net operating cashflow >10%.
- Exclude 30% of companies displaying the worst net operating cashflow to total assets ratio.
- Growth of the ratio (average net operating cashflow / Total Assets) >0 over the last two years.
- Exclude companies with total debt to total assets ratio >35%.
- Rank eligible companies according to growth of net operating cashflow in descending order.
- Select top 30 companies.
- Quarterly rebalancing.
- Buffer rule: If a company is in the index, it will only be excluded if it does not fulfill the criteria anymore.
- Weighting schemes: Two versions -> free float mcap weighted and inverse volatility weighted.
- No sector constraints.
- Index currencies: USD for the DM version, and EUR for the European version.
Cashflow Pays
In this section, we describe the back-tested performance of the different gross total return index versions.
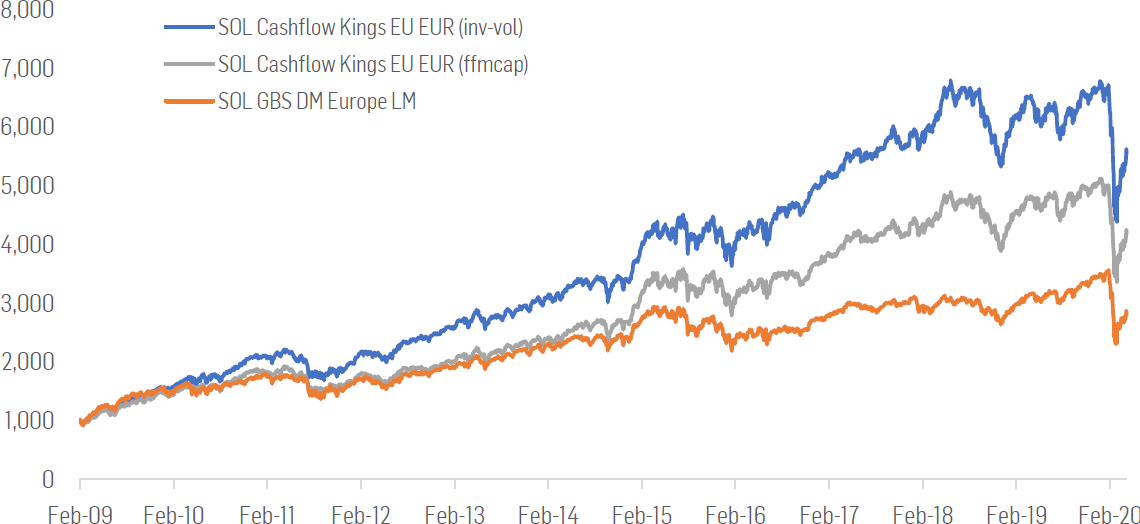
The performance in comparison to the benchmark is convincing. However, the sheer performance number of a back-test – after being in a bull market for over a decade – can be misleading. The selection strategy picks stocks of the fastest-growing companies that could show a higher volatility than the broad market. Without giving up on the benefits of the selection criteria, we tackle the potentially high volatility of the fastest-growing companies in the inverse-vol-weighted versions. We analyze the historical performance for the period of the last eleven years. Thus, our time series starts around the trough of the financial crises, on Feb-25, 2009.
The Solactive GBS Developed Markets Large & Mid Cap USD Index returned 12.16% annually on average, whereas the Solactive Cashflow Kings DM Index would have beaten this performance by around 1.75 percentage points, both in the free-float-mcap version and the inverse-vol-weighted version.
For European stocks, the strategy would have worked even better. The average annual performance of the inverse-vol-weighted version stood at 16.55%. Hence, the re-weighting according to the inverse volatility would have been beneficial, as the average annual return of the free-float-mcap version was 13.65%. In comparison, the Solactive GBS Developed Markets Europe Large & Mid Cap EUR Index delivered 9.68% over the same time frame. All performance details can be found in the following table.
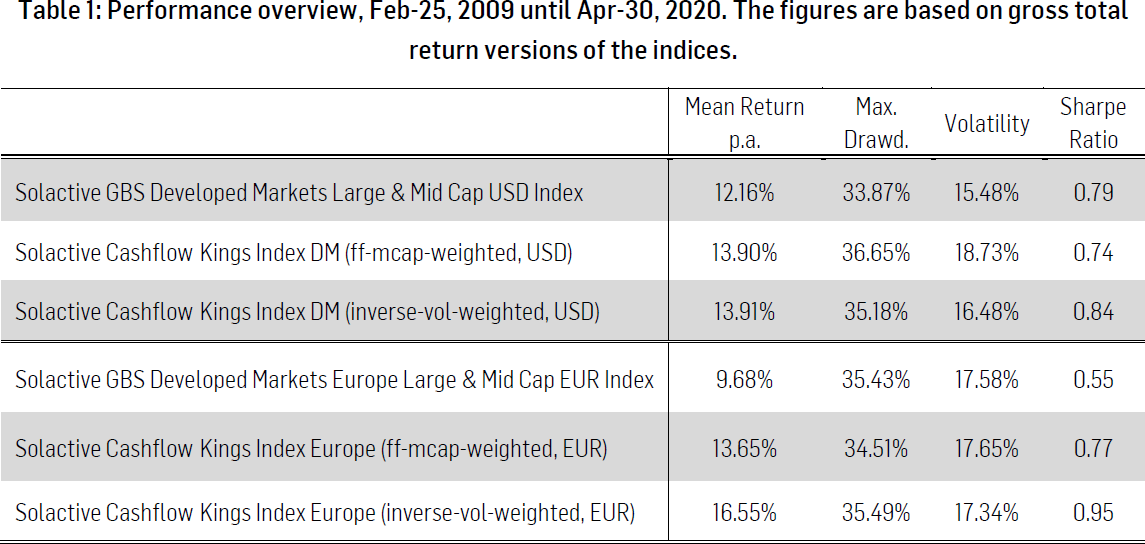
Source: Solactive
Figure 1: Performance Developed Markets, Feb-25, 2009 until Apr-30, 2020.
The charts are based on gross total return versions of the indices.
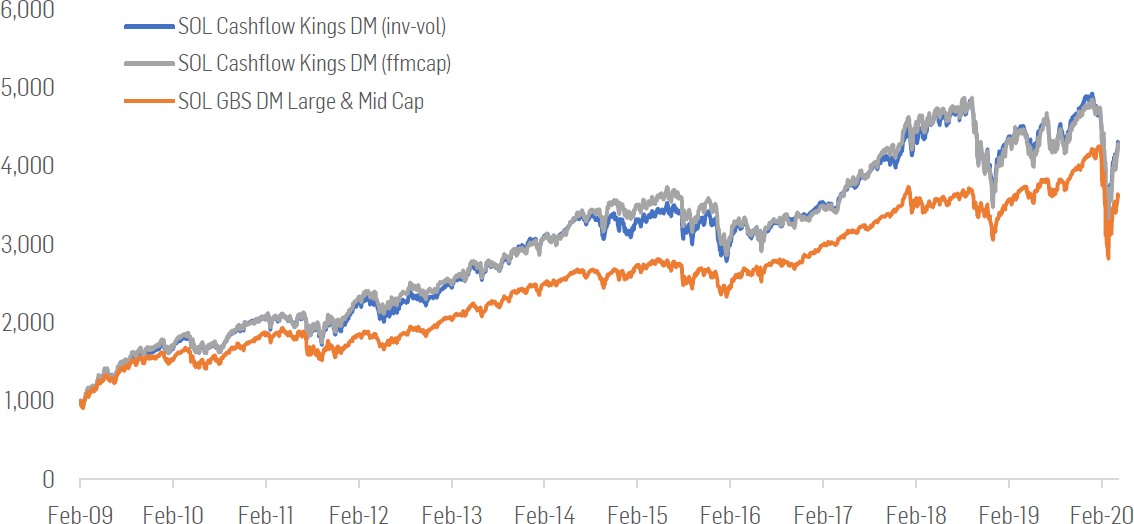
Source: Solactive
Figure 2: Performance Europe, Feb-25, 2009 until Apr-30, 2020.
The charts are based on gross total return versions of the indices.
 Source: Solactive
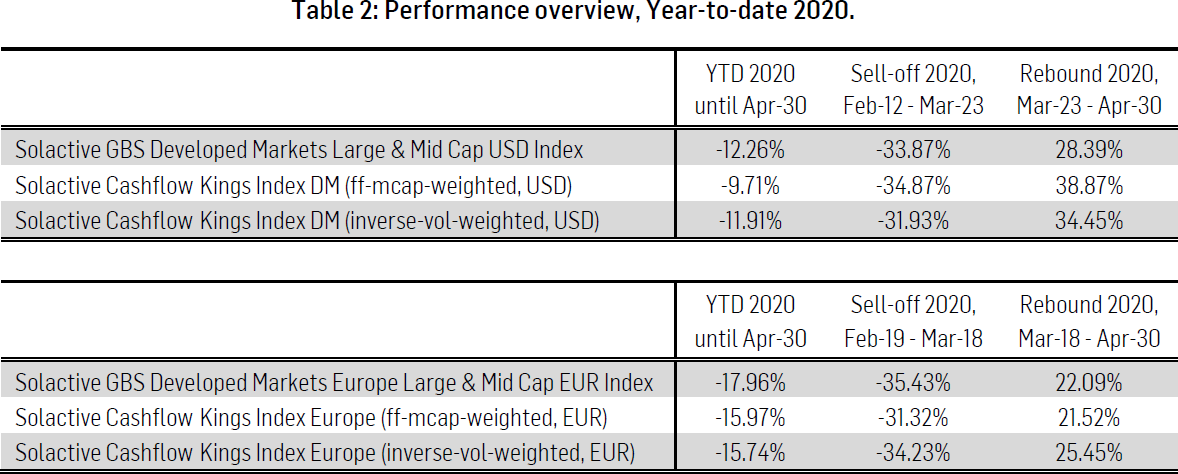
Performance details 2020
Year-to-date until Apr-30, 2020, the global developed markets as well as the European versions of the strategy outperformed the benchmarks. During the peak-to-trough period, the index concept was either in line or slightly better than the respective benchmark. Details can be found in the following table.
Sector Analysis
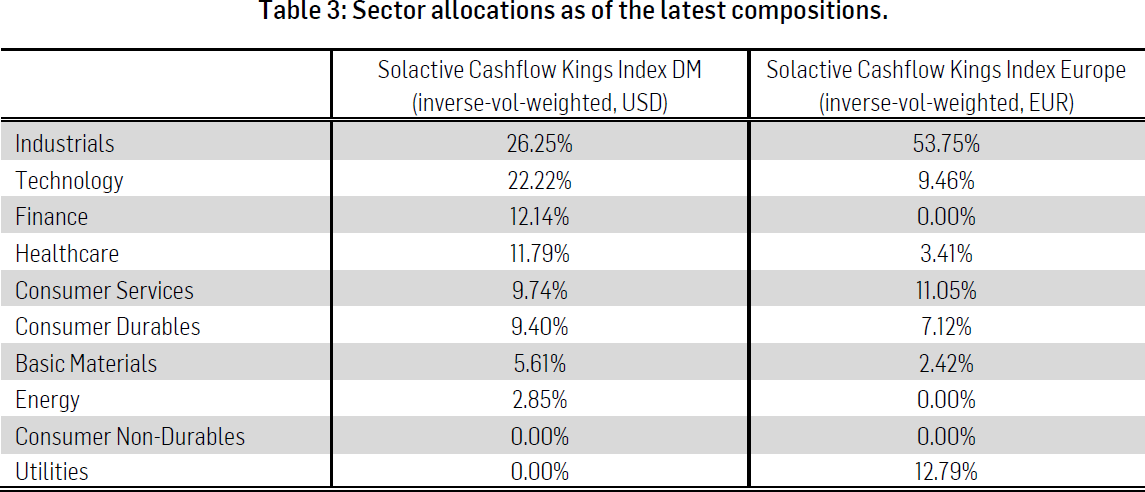
In the presented versions, we have not implemented any sector constraints. We only selected the eligible stocks from the equity benchmark universes Solactive GBS Developed Markets Large & Mid Cap USD Index and Solactive GBS Developed Markets Europe Large & Mid Cap EUR Index. Without sector constraints, the European version is heavily tilted towards Industrials, whereas the global DM version is more diversified among sectors. The sector weights as of the latest compositions are shown in the table below.
Final Remarks
The Solactive Cashflow Kings Index Strategy relies on a continuation of a positive cashflow growth. Companies do not become giants overnight but grow step by step. With this index concept, we try to anticipate future cashflow growth that may well translate into a strong stock performance at an early stage and allocate accordingly. The underlying principles simply assume that the companies having been able to demonstrate superior cashflow growth figures are successful for a reason. This reason is scarcely luck, but mostly an advantage over competitors. This advantage could have its origin in a strong market position or in having established a uniqueness as well as high barriers to entry. It could also be on the back of technological innovation or on other reasons. Regardless of where the strong growth of net operating cashflow stems from, we show that the index selection criteria of a growing cashflow that is not “borrowed” through leverage, pays off.
Dr. Axel Haus, Team Head Qualitative Research
Jessica Rechter, Quantitative Research Associate
Solactive AG