Shining Green: Bonds to Tackle Climate Change
|
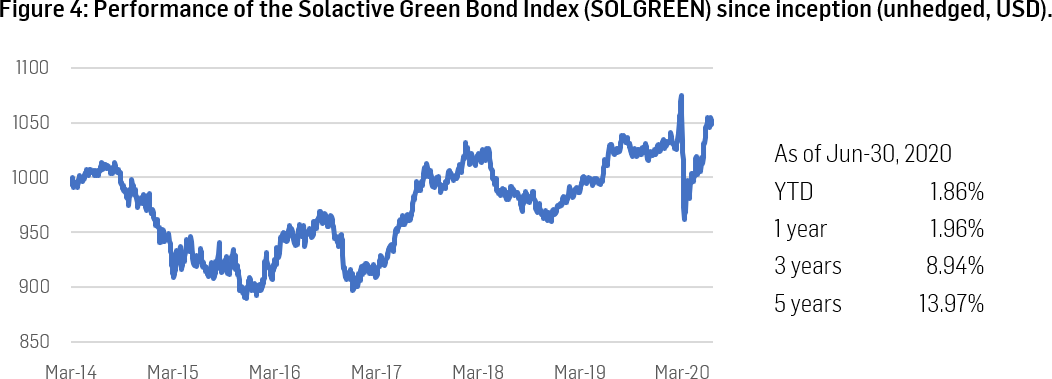
Green Bonds are on the rise and have grown to over half a trillion USD in market value. The Solactive Green Bond Index (SOLGREEN) invests in bonds that are defined as Green Bonds by the Climate Bonds Initiative (CBI). So-called ‘self-labeled Green Bonds’ are not eligible for inclusion into the index universe. Our index was the first Green Bond index and, thus, provides the longest available live history. The index’s total performance is comparably good at around 14% over the last five years until Jun-30, 2020. The compounded annual growth rate of the outstanding market value of bonds in our index is above 70% over the last six years. Whereas this growth will likely slow down as the market matures, there is more to come. Recent regulatory activities confirm the growing importance of the Green Bond market. |
The Rise of Green Bonds
The Green Bond market is slightly over ten years old, but its growth has gained pace recently. The Climate Bonds Initiative (CBI) reports a 51% increase in issuance volume in 2019 in comparison to 2018 and expects further growth in 2020.1 In this blog post, we focus on the Solactive Green Bond Index and describe its universe. Our index, which provides the longest available live history among Green Bond indices, represents a comprehensive Green Bond universe, as we only select bonds that are defined as Green Bonds by the CBI. Furthermore, in order for a bond to be eligible for inclusion into the index universe, its amount outstanding must be at least USD 100m, its time to maturity at least six months, and we exclude inflation-linked bonds, convertible bonds, US municipal bonds, ABS/MBS, and other types of structured securities.2 The index is created to track the global Green Bond market.
The market for Green Bonds is gaining traction for two reasons. First, investors are paying more attention to ESG- and climate-friendly investment solutions. Second, regulators around the globe are taking actions to increase the transparency and to lead the way towards establishing commonly accepted standards for Green Bonds. Additionally, regulators increasingly are requiring investors to take sustainability considerations into account. These factors will increase the demand for Green Bonds and thus most likely support the prices and performance of Green Bonds.
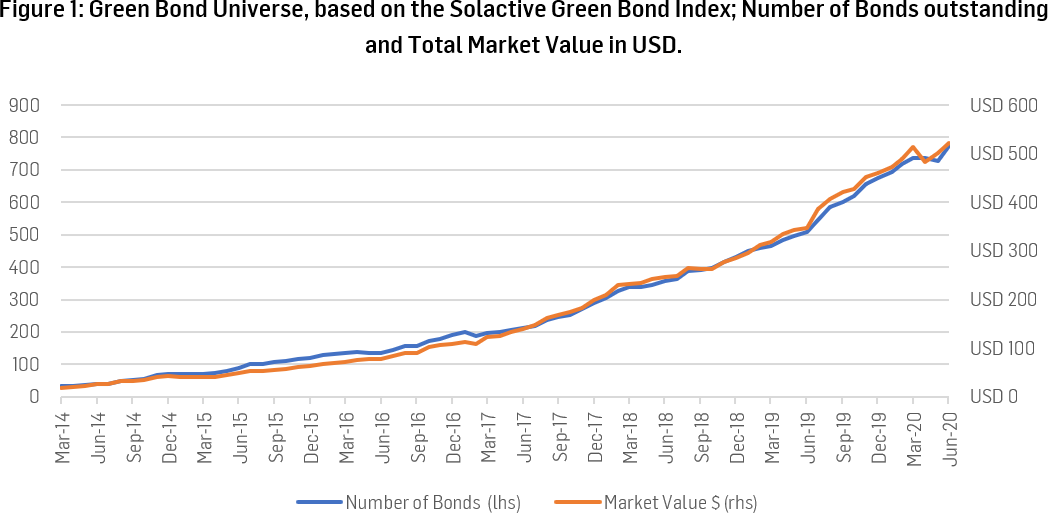
In early 2014, there were 33 bonds in the Solactive Green Bond Index with a total market value of USD 19.2bn. Today, the number of bonds in the index has risen to 775, and their total market value has passed the half-a-trillion-mark – at USD 522.9bn. During this growth period, the index’s currency exposure has broadened to 20 different currencies. In 2014, the number of currencies the index was exposed to stood at 8.
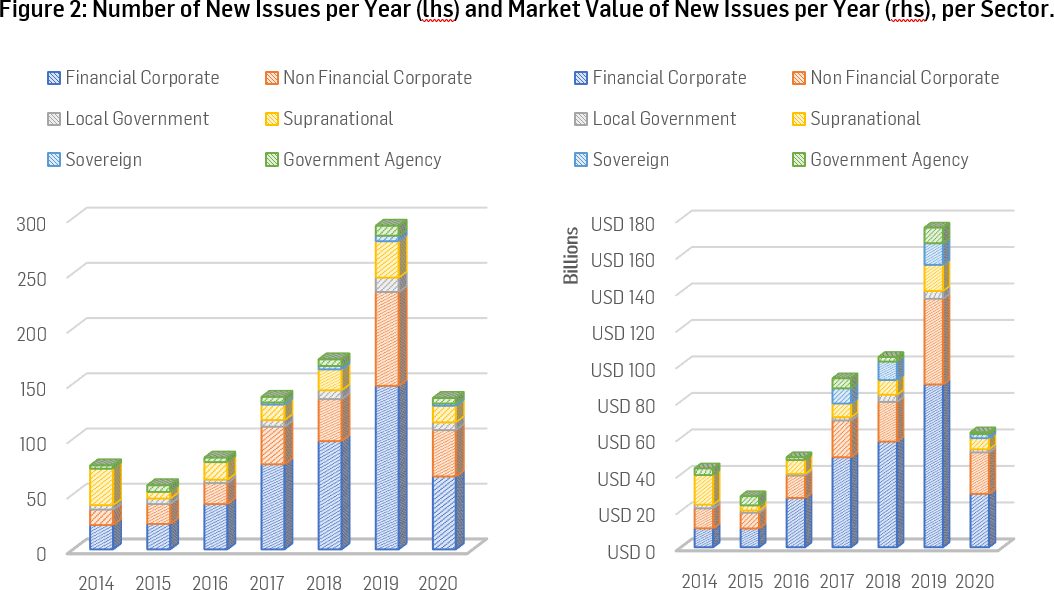
In 2019, 293 Green Bonds, with a total value of USD 175.2bn, were issued – both numbers increased by around 70% over the 2018 respective figures of 172 and USD 104.3bn.
Source: Solactive
Greenwashing at its Best?
Green Bonds are generally the same as standard bonds but have a “green” feature. The idea behind them is to use the money that is raised through the issuances of Green Bonds for projects that positively affect the environment or contribute to the fight against climate change. The purpose of the money is linked to “green” endeavors, whereas the bond is backed by the balance sheet or liquidity of the issuer. Thus, the credit profile and risk of Green Bonds are, in general, the same as for standard bonds from the same issuer.
The purpose of Green Bonds is that the bond issuers promise to use the proceeds for eco-friendly projects or investments. However, the financiers may not have specific control mechanisms in place that guarantee the usage of the funds in the desired way by debtors. Therefore, bond investors potentially face the risk of becoming victims of unjustified greenwashing activities by companies, agencies, governments, or other Green Bond issuers. This risk is especially latent for so-called ‘self-labeled Green Bonds’. A similar phenomenon could recently be observed in the market for Social Bonds. The standards in this newer bond market are ambiguous, and debtors have increased the issuance of Social Bonds. According to the Financial Times, analysts deem some issuers of Social Bonds as too vague with respect to the usage of their bond’s proceeds. A potential social washing is feared alongside this rapidly growing segment of the debt market. While the issuances of Green Bonds have dropped during the first half of 2020, that of Social Bonds has reached USD 50bn, which is more than double the amount raised over the entirety of 2019.3 Criticism may arise over the practice of issuers tending to move towards a less-established market for Social Bonds, in which common standards have not been developed.
To overcome the challenge of unjustified greenwashing by bond issuers, the CBI checks and officially defines legitimate Green Bonds. In our Solactive Green Bond Index, we only allow Green Bonds as defined by the CBI as eligible constituents for our Green Bonds universe. In this way, investors in securities linked to the Solactive Green Bond Index can rest assured that they invest in bonds whose proceeds are used in activities related to a more eco-friendly world. Thus, for investors, the index offers sustainable and environmentally-friendly investing at its best.
SOLGREEN at a Glance
In this blog post, we focus on the characteristics of the Solactive Green Bond Index. Since the abovementioned selection criteria lead to exclusions, our universe is smaller than that of the overall Green Bond universe covered by the CBI. For instance, the bond issuance volume based on our index stood at USD 176.4bn in 2019, while the CBI Green Bond database exhibits an issuance volume of USD 257.5bn in that same year.1
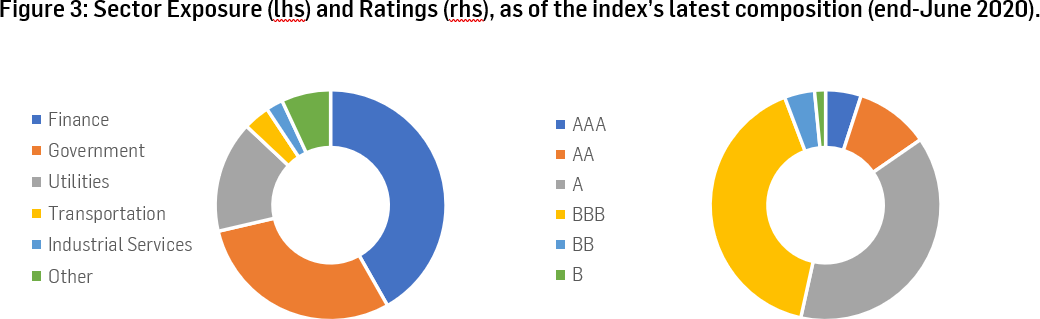
With close to USD 90bn issuance volume in 2019, financial corporates are still the largest group in the index. As of the index’s latest composition at the end of June 2020, financials had a weight of 41.8% – based on outstanding market value. However, it is worth noting that non-financial issuers are catching up quickly, both in absolute and relative terms.
Source: Solactive
The yield to maturity of the index’s constituents – based on the weighted average – stands at 1.16% and its modified duration at 6.79, as of its latest composition. 5.0% of the outstanding market value sits in bonds with a AAA-rating, followed by 10.4% and 38.1% in bonds with a AA- and a A-rating, respectively. The most heavily represented credit rating in the index is the BBB-rating, with 40.77%.
Source: Solactive
During a bumpy first half of 2020, the SOLGREEN Index returned 1.86%. Between Mar-09, 2020 and Mar-19, 2020, the index dropped by 10.5% in value, but the rebound of 9.27% thereafter brings the index to a total 5-year-performance of 13.97%. These figures, as well as the graph below, are based on the unhedged version of the index. Thus, currency fluctuations may play a role in the index’s performance. For instance, the weak performance of the index until the end of 2015 is likely due to a strengthening USD against other currencies. There are 20 different currencies in the index today, and the index-currency is USD.
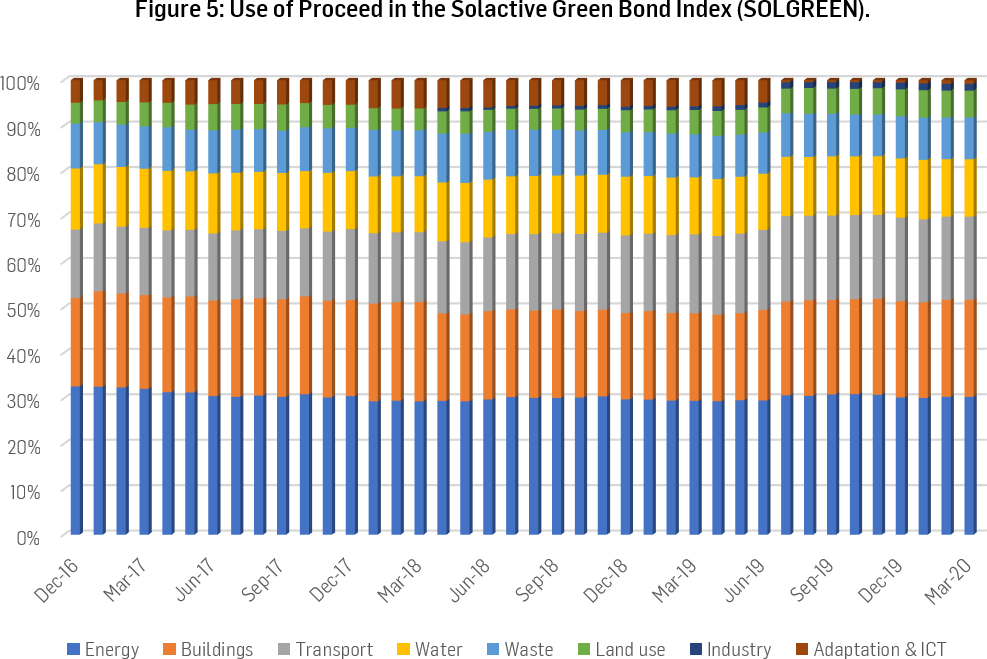
Most of the proceeds of Green Bonds outstanding in the index’s universe are invested in energy, building, and transportation projects. Other eligible uses of proceeds are water, waste, land use and marine resources, industry, and information & communications technology.
A detailed look at the biggest individual and country-level issuers of the index presents a clear picture: The index is globally, as well as with respect to the different kinds of issuers, well-diversified. A perfect example of a Green Bond issuer is the Société du Grand Paris. Year-to-date, it is the largest issuer of Green Bonds and makes France the number-one country issuer since the beginning of the year. The Société du Grand Paris has been established in 2010 by the French Government with the objective to construct the Grand Paris Express network, which expands the Parisian metro and rail transport network. The grid is powered entirely by electricity and has a high capacity utilization. For these reasons, it is compliant with the CBI low carbon transport criteria.4
Biggest Issuers: |
|||||
|
Since launch of the index |
During 2019 |
During H1 2020 |
|||
|
KfW |
4.28% |
Industrial Bank Co Ltd |
6.78% |
Societe du Grand Paris |
5.65% |
|
European Investment Bank |
4.22% |
KfW |
4.40% |
E.ON SE |
4.74% |
|
Industrial Bank Co Ltd |
2.13% |
Netherlands, Kingdom of the (Government) |
4.06% |
Chile, Government of |
4.18% |
|
Engie SA |
2.09% |
Engie SA |
2.23% |
Digital Dutch Finco BV |
3.01% |
|
International Bank for Reconstruction and Development |
1.89% |
International Bank for Reconstruction and Development |
2.03% |
EDP Energias de Portugal SA |
3.00% |
|
Societe du Grand Paris |
1.53% |
European Investment Bank |
2.03% |
Citigroup Inc |
2.86% |
|
TenneT Holding BV |
1.44% |
Societe du Grand Paris |
2.01% |
Eurofima European Company for the Financing of Railroad Rolling Stock |
2.78% |
|
Mexico City Airport Trust |
1.42% |
E.ON SE |
1.86% |
China Development Bank |
2.74% |
|
France, Republic of (Government) |
1.35% |
Industrial and Commercial Bank of China Ltd (Hong Kong Branch) |
1.79% |
Credit Agricole Home Loan SFH SA |
2.63% |
|
Shanghai Pudong Development Bank Co Ltd |
1.32% |
Chile, Government of |
1.38% |
Hua Xia Bank Co Ltd |
2.60% |
Biggest Country Issuers: |
|||||
|
Since launch of the index |
During 2019 |
During H1 2020 |
|||
|
United States of America |
11.77% |
China |
13.15% |
France |
12.03% |
|
France |
11.60% |
United States of America |
11.77% |
United States of America |
11.24% |
|
China |
10.63% |
Netherlands |
10.38% |
China |
9.81% |
|
Netherlands |
9.56% |
Germany |
10.16% |
Germany |
7.60% |
|
Germany |
9.27% |
France |
9.29% |
Sweden |
7.19% |
|
Luxembourg |
6.06% |
United Kingdom |
4.28% |
Netherlands |
6.39% |
|
United Kingdom |
3.49% |
Hong Kong |
3.86% |
United Kingdom |
4.85% |
|
Sweden |
3.19% |
Luxembourg |
3.11% |
Spain |
4.83% |
|
Canada |
2.81% |
Canada |
2.86% |
Switzerland |
3.98% |
|
Spain |
2.80% |
Spain |
2.65% |
Denmark |
3.78% |
|
Hong Kong |
2.49% |
Sweden |
2.61% |
Chile |
3.41% |
Continued Growth Expected
Over the last six years, the compounded annual growth rate of the market value of bonds in the Solactive Green Bond Index is higher than 70%. After having reached more than half a trillion USD in value, this pace is likely to slow down in relative terms. After the impressive growth rates over the past couple of years, the Green Bond market is not yet on track for another record-setting year in 2020. But despite this fact, there is certainly more to come. Investor’s recently increasing focus on eco-friendly investments is particularly supportive. Further, regulatory efforts confirm the rising importance of the Green Bond market.
Regulatory activities within the European Union – as an example – not only focus on operating or producing companies’ businesses but also on investors. Thus, they aim at directing the focus of financiers and investors towards sustainable investing. As of the publication date of this blog post, the European Commission is going through an open feedback period for a proposal regarding a regulation with the title “Ecofriendly investment – EU standard for ‘green bonds’”. The feedback period is open from Jun-12, 2020 until Aug-07, 2020, and the adoption of a new standard for the EU is planned for the first quarter of 2021. The request for feedback states the following:
“The shift to a low-carbon economy involves investing in ecofriendly assets and projects. Getting public and private investors to buy ‘green bonds’ is an important way of raising the necessary capital.
This initiative aims to attract more finance for sustainable investment by establishing an EU standard for ‘green bonds’, setting out clearly which assets and projects the money can be used for.” 5
Even though the clarity around Green Bonds and their labeling is not yet perfect, its market size has already risen notably. If there are supranational broadly acknowledged standards, this growth will likely continue. The CBI has not revised their projections for 2020 and expects yet another record year of Green Bond issuance in 2020. However, in order to reach a new record, there will have to be a pick-up during the second half of 2020.
Final Remarks
If investors have non-financial interests, for instance, to invest in bonds that were issued in order to finance eco-friendly projects, then they can get the best of two worlds: gaining exposure to bonds and contributing to the fight against climate change. After high growth rates over the last couple of years, there is undoubtedly further growth to be expected. Whereas there could always be the possibility of Green Bond issuers being accused of greenwashing, especially if they do not get an official label, this issue will likely become less of a problem in the future. If there is a well-functioning and regulated evaluation of the Green Bond labeling process, then investors will make use of it. Thus, the transparency for these kinds of bonds will increase, and investors can be assured of what they get. In the Solactive Green Bond Index, we have already overcome this challenge by relying on the labelling process of the Climate Bonds Initiative. The index offers a broadly diversified Green Bond investment, with a solid rating scheme and a comparably good performance.
Dr. Axel Haus, Team Head Qualitative Research
Solactive AG
References
[1] Climate Bonds Initiative, “2019 Green Bond Market Summary”, https://www.climatebonds.net/files/reports/2019_annual_highlights-final.pdf.
[2] Guideline Solactive Green Bond Index, https://www.solactive.com/wp-content/uploads/2018/10/Guideline_Solactive-Green-Bonds-Index_Update_20181101.pdf.
[3] Rise in Covid-19 bond issuance fans fears over ‘social washing’, Financial Times online, Jun-30, 2020.
[4] Climate Bonds Initiative, https://www.climatebonds.net/certification/societe-du-grand-paris.
[5] Proposal for a regulation; Ecofriendly investment – EU standard for ‘green bonds’, https://ec.europa.eu/info/law/better-regulation/have-your-say/initiatives/12447-EU-Standard-for-Green-Bond.