Shining Green: Bonds to Tackle Climate Change
July 2020, 1st Revision: September 2021
|
Green Bonds are on the rise and have grown to over USD 800bn in market value. The Solactive Green Bond Index (SOLGREEN) includes bonds that are defined as Green Bonds by the Climate Bonds Initiative (CBI). So-called ‘self-labeled Green Bonds’ are not eligible for inclusion into the index universe. Our index was the first Green Bond index and, thus, provides the longest available live history.
|
Comment on Recent Performance
With aggregate demand recovering from the COVID-19 pandemic lows and after the global economy has started its recovery, inflation expectations – as inflation itself – increased during the first half of 2021. This can be illustrated by looking at the US 5-Year, 5-Year Forward Inflation Expectation Rate published by the Fed St. Louis. The 5y5y inflation expectations rose around 20 basis points during the first six months of 2021.1 Similarly, still according to the Fed St. Louis, the US 10-Year Breakeven Inflation Rate increased by more than 30 basis points.2 In this environment, the 10y US-Treasury yield went up from 0.96% to 1.45% between the end of last year and June-30, 2021.3 As the Solactive Green Bond Index (SOLGREEN) tends to have a duration in the high single digits, the performance does not remain unaffected from inflation and general yield developments. We comment on the negative performance of the index during the first half of 2021 and display a graph in the section “SOLGREEN at a glance”.
The Rise of Green Bonds
The Green Bonds market is slightly over ten years old, and its growth has gained pace recently. The Climate Bonds Initiative (CBI) reports that the Green Bonds market increased by USD 290bn in 2020, which represents a 9% increase in new issuances in comparison to 2019. In this blog post, we focus on the Solactive Green Bond Index and describe its universe. Our index, which provides the longest available live history among Green Bond indices, represents a comprehensive Green Bonds universe, as we only select bonds that are defined as Green Bonds by the CBI. Furthermore, in order for a bond to be eligible for inclusion into the index universe, its amount outstanding must be at least USD 100m and the time to maturity at least six months. Inflation-linked bonds, convertible bonds, US municipal bonds, ABS/MBS, and other types of structured securities are excluded.4 The index is created to track the global Green Bonds market.
The market for Green Bonds is gaining traction particularly for two reasons. First, investors are paying more attention to ESG- and climate-friendly investment solutions. Second, regulators around the globe are taking actions to increase transparency and to lead the way towards establishing commonly accepted standards for Green Bonds. Additionally, regulators increasingly are requiring investors to take sustainability considerations into account. These factors will increase the demand for Green Bonds and thus most likely support the prices and performance of Green Bonds.
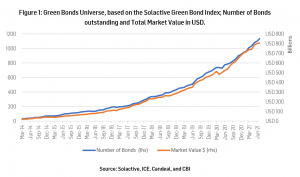
In early 2014, there were 33 bonds in the Solactive Green Bond Index with a total market value of USD 19.2bn. Today, the number of bonds in the index has risen to 1137 and their total market value has reached USD 809.2bn. During this growth period, the index’s currency exposure has broadened to 24 different currencies. In 2014, the number of currencies the index was exposed to stood at 8.
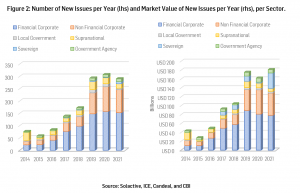
In 2020, 307 Green Bonds, with a total value of USD 168bn, were issued – increasing the number of new issuances by 4.8% in comparison to 2019. On the other hand, the market value of the new issuances is lower in 2020 contrasted to the previous year. These numbers refer to Green Bonds that fulfil the SOLGREEN Index criteria.
Contributing to a Greener World
Green Bonds are generally the same as standard bonds but have a “green” feature. The idea behind them is to use the money that is raised through the issuances of Green Bonds for projects that positively affect the environment or contribute to the fight against climate change. The purpose of the money is linked to “green” endeavors, whereas the bond is backed by the balance sheet or liquidity of the issuer. Thus, the credit profile and risk of Green Bonds are, in general, the same as for standard bonds from the same issuer.
The purpose of Green Bonds is that the bond issuers promise to use the proceeds for eco-friendly projects or investments. However, the financiers may not have specific control mechanisms in place that guarantee the usage of the funds in the desired way by debtors. Therefore, bond investors potentially face the risk of becoming victims of unjustified greenwashing activities by companies, agencies, governments, or other Green Bond issuers. This risk is especially latent for so-called ‘self-labeled Green Bonds’. A similar phenomenon could recently be observed in the market for Social Bonds. The standards in this newer bond market are ambiguous, and debtors have increased the issuance of Social Bonds. According to the Financial Times, analysts deem some issuers of Social Bonds as too vague with respect to the usage of their bond’s proceeds. A potential social washing is feared alongside this rapidly growing segment of the debt market. While the strong growth in issuances of Green Bonds took a breather in 2020, the size of the social bond market increased by 1017%, reaching a market size of USD 249bn (Source: Solactive, ICE, Candeal, and CBI). Criticism may arise over the practice of issuers tending to move towards a less-established market for Social Bonds, in which common standards have not been developed.
To overcome the challenge of unjustified greenwashing by bond issuers, the CBI checks and officially defines legitimate Green Bonds. In our Solactive Green Bond Index, we only allow Green Bonds as defined by the CBI as eligible constituents for our Green Bonds universe. In this way, investors in securities linked to the Solactive Green Bond Index can rest assured that they invest in bonds whose proceeds are used in activities related to an eco-friendlier world. Thus, for investors, the index offers sustainable and environmentally friendly investing.
SOLGREEN at a Glance
In this blog post, we focus on the characteristics of the Solactive Green Bond Index. Since the abovementioned selection criteria lead to exclusions, our universe is smaller than that of the overall Green Bonds universe covered by the CBI. For instance, the bond issuance volume based on our index stood at USD 168bn in 2020, while the CBI Green Bonds database exhibits an issuance volume of USD 290bn in that same year.5
With USD 81bn issuance volume in 2020, financial corporates are still the largest group in the index. As of the index’s latest composition at the end of June 2021, financials had a weight of 39.5% – based on outstanding market value. However, it is worth noting that non-financial issuers are catching up quickly, both in absolute and relative terms.
In the first half of 2021 the market value of the new issuances is already higher than in 2020. This spectacular increase is potentially due to regulatory activities as well as to the post-pandemic recovery plan implemented by the European Commission. This is further addressed in section “Further Growth Expected”.
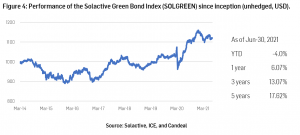
During the first half of 2021, the SOLGREEN Index returned -4%. Due to its duration in the high single digits, the index is sensitive to interest rate movements and has suffered from the steepening of yield curves in the first half of 2021. As inflation expectations have affected the bond market, the index has not been spared.
As of today, the index has a cumulative return of 17.62% over the past five years. These figures, as well as the graph below, are based on the unhedged version of the index. Thus, currency fluctuations may play a role in the index’s performance. For instance, the weak performance of the index until the end of 2015 is likely due to a strengthening USD against other currencies. There are 20 different currencies in the index today, and the index-currency is USD.
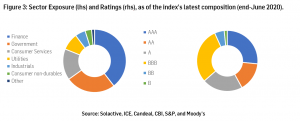
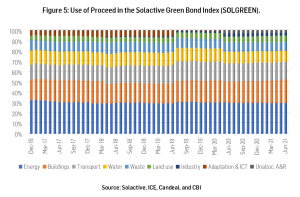
Most of the proceeds of Green Bonds outstanding in the index’s universe are invested in energy, building, and transportation projects. Other eligible uses of proceeds are water, waste, land use and marine resources, industry, and information & communications technology.
 A detailed look at the biggest individual and country-level issuers of the index presents a clear picture: The index is globally, as well as with respect to the different kinds of issuers, well-diversified. A perfect example of a Green Bond issuer is the Société du Grand Paris. In 2020, it was the largest issuer of Green Bonds and made France the number-one Green bonds country issuer that year. The Société du Grand Paris has been established in 2010 by the French Government with the objective to construct the Grand Paris Express network, which expands the Parisian metro and rail transport network. The grid is powered entirely by electricity and has a high capacity utilization. For these reasons, it is compliant with the CBI low carbon transport criteria.6 This year, the German government is the largest Green Bonds issuer followed by the French Government. In 2021, Europe is leading the dance in the sustainable finance sector. Since the beginning of the year European Union countries have accounted for nearly 50% of the Green Bonds issuances. (Source: Solactive, ICE, Candeal, and CBI).
Table 1: Biggest Issuers and Biggest Country Issuers in the Solactive Green Bond Index.
|
Biggest Issuers: |
|||||
|
Since launch of the index |
During 2020 |
Since the beginning of the year |
|||
|
KfW |
4.7% |
Societe du Grand Paris |
6.01% |
Bundesrepub. Deutschland |
7.83% |
|
European Investment Bank |
4.0% |
KfW |
3.46% |
Govt of France |
4.26% |
|
Societe du Grand Paris |
2.4% |
European Investment Bank |
2.13% |
KfW |
3.46% |
|
Bundesrepub. Deutschland |
1.9% |
E.ON SE |
1.50% |
Bundesobligation |
3.29% |
|
Engie SA |
1.9% |
Digital Dutch Finco BV |
1.47% |
European Investment Bank |
2.35% |
|
Industrial Bank Co Ltd |
1.5% |
Apple Inc. |
1.43% |
Equinix Inc. |
1.93% |
|
TenneT Holding BV |
1.5% |
Volkswagen INTL FIN NV |
1.41% |
Engie SA |
1.67% |
|
International Bank for Reconstruction and Development |
1.4% |
Landwirtsch Rentenbank |
1.32% |
Caixabank SA |
1.61% |
|
China Development Bank |
1.2% |
Government of Chile |
1.32% |
China Development Bank |
1.58% |
|
Asian Development Bank |
1.1% |
Sparebank 1 Boligkreditt |
1.20% |
Societe du Grand Paris |
1.38% |
|
Biggest Country issuers: |
|||||
|
Since launch of the index |
During 2020 |
Since the beginning of the year |
|||
|
Germany |
12.45% |
France |
13.28% |
Germany |
20.12% |
|
China |
12.26% |
United States |
12.83% |
France |
11.24% |
|
France |
11.64% |
Germany |
12.04% |
United States |
10.43% |
|
United States |
11.48% |
China |
8.54% |
China |
5.94% |
|
Netherlands |
6.40% |
Netherlands |
5.27% |
Netherlands |
5.87% |
|
Spain |
4.25% |
Spain |
4.17% |
Sweden |
5.79% |
|
Luxembourg |
4.05% |
Sweden |
4.01% |
Spain |
5.12% |
|
Sweden |
3.60% |
Japan |
3.53% |
Italy |
3.07% |
|
Canada |
2.65% |
Norway |
3.14% |
Finland |
2.78% |
|
Italy |
2.59% |
United Kingdom |
3.01% |
Luxembourg |
2.53% |
|
United Kingdom |
2.54% |
Luxembourg |
2.89% |
Norway |
2.49% |
Source: Solactive, ICE, Candeal, and CBI
Continued Growth Expected
Over the last seven years, the compounded annual growth rate of the market value of bonds in the Solactive Green Bond Index is close to 70%. After having reached more than half a trillion USD in value in 2019 and achieving impressive growth rates over the past couple of years, the growth of the Green Bonds market has slowed down in 2020. But despite this fact, there is certainly more to come. Investor’s recently increasing focus on eco-friendly investments is particularly supportive. Further, regulatory efforts confirm the rising importance of the Green Bonds market especially in Europe and in the United States. 7
Regulatory activities within the European Union – as an example – not only focus on operating or producing companies’ businesses but also on investors. Thus, they aim at directing the focus of financiers and investors towards sustainable investing. The regulation is titled “Ecofriendly investment – EU standard for ‘green bonds’” and was adopted in the first quarter of 2021.8
The Green Bonds market’s growth has doubled in Q2 2021 in comparison to the first quarter. This is partly the result of the post pandemic recovery plan implemented by the European Commission. This plan is named ‘Next Generation EU’ and aims to steer post-COVID-19 Europe towards a greener, more digital, and resilient future. So far, the NGEU plan has gathered EUR 1.8tn and is expected to raise an additional EUR 800bn by the end of 2026. 30% of this amount (EUR 250bn) will be funded by progressive Green Bonds issuance, which has started in Q2 2021.9
The CBI expects 2021 to be a solid year for the Green Bonds market, notably backed by increasing policy support to achieve a transition to net zero by 2050 on a worldwide level, including in the US, Europe, and China. The return of green multilateralism (after US re-joining the Paris Accord) as well as the development and harmonization of green taxonomies are also expected to play an essential role.
Final Remarks
If investors have non-financial interests, for instance, to invest in bonds that were issued to finance eco-friendly projects, then they can get the best of two worlds: gaining exposure to bonds and contributing to the fight against climate change. After high growth rates over the last couple of years, there is undoubtedly further growth to be expected. Whereas there could always be the possibility of Green Bonds issuers being accused of greenwashing, especially if they do not get an official label, this issue will likely become less of a problem in the future. If there is a well-functioning and regulated evaluation of the Green Bonds labeling process, then investors will make use of it. Thus, the transparency for these kinds of bonds will increase, and investors can be assured of what they get. In the Solactive Green Bond Index, we have already overcome this challenge by relying on the labelling process of the Climate Bonds Initiative. The index offers a broadly diversified Green Bonds investment, with a solid rating scheme and a comparably good performance.
References
[1] 5y5y Forward Inflation Expectation Rate; FED St Louis, https://fred.stlouisfed.org/series/T5YIFR
[2] 10 year Breakeven Inflation Rate; FED St Louis, https://fred.stlouisfed.org/series/T10YIE
[3] 10 year US Treasury Constant Maturity Rate; FED St Louis, https://fred.stlouisfed.org/series/DGS10
[4] Guideline Solactive Green Bond Index, https://www.solactive.com/wp-content/uploads/2018/10/Guideline_Solactive-Green-Bonds-Index_Update_20181101.pdf.
[5] Sustainable Debt Global State of Market 2020, Climate Bonds Initative, https://www.climatebonds.net/files/reports/cbi_sd_sotm_2020_04d.pdf
[6] Climate Bonds Initiative, https://www.climatebonds.net/certification/societe-du-grand-paris
[7] Green bonds are beating all expectations in post-pandemic recovery; GreenBiz Aug-4 2021,
https://www.greenbiz.com/article/green-bonds-are-beating-all-expectations-post-pandemic-recovery
[8] Proposal for a regulation; Ecofriendly investment – EU standard for ‘green bonds’, https://ec.europa.eu/info/law/better-regulation/have-your-say/initiatives/12447-EU-Standard-for-Green-Bond.
[9] Next Generation EU Green Bonds; European Commission,