Fallen Angels! Future Stars?
|
In this blog post, Solactive proposes an investable USD Fallen Angel Index with turnover control. Fallen Angel bonds are defined as bonds which have recently been downgraded from the Investment-Grade to the High Yield segment while belonging to the relatively attractive BB+ to BB- rating segment. We show that our strategy has outperformed both our High Yield and our Investment-Grade Benchmark indices. We argue structural differences between the High Yield and Investment Grade markets are the driver for this outperformance. |
Passive for High Yield Bonds
Corporate bond markets and passive strategies tracking those markets have been one of the fastest-growing areas in recent years. While the investment-grade corporate bond market is very large and well covered by financial products, the degree of product breadth is much lower for the corporate high yield market. Solactive AG is one of the most innovative index providers in this space. In 2016 Solactive AG launched its Solactive USD High Yield Corporates Total Market Index Family. The index family includes a broad market benchmark, a high beta risk on strategy, a low beta risk-off strategy as well as a short duration index. The building blocks of this family allow financial institutions to construct bespoke and transparent investment solutions. Building on our expertise in the USD high yield space, Solactive AG has developed another strategy, which gives product issuers direct access to the Fallen Angels segment of the USD High Yield Market.
Investment Grade vs. High Yield
Traditionally corporate bond markets are divided into two segments: the high-quality investment-grade segment and the lower-quality high yield segment, which is also referred to as the junk bond segment. The investment-grade segment includes all bonds, which are rated above BB+/Ba1 on the rating scale used by S&P Ratings and Moody’s Investors Services. This classification means that everything rated BB+/Ba1 or below is considered to be the high yield or sub-investment grade segment. Besides the obvious yield and rating differences, there are other lesser known but still important differences between the two bond market segments:
Compared to the corporate investment-grade market, the corporate high yield market is considerably smaller, and its growth only accelerated in the 1970s and 1980s. The combined market value of Solactive’s USD Investment Grade Corporate Index is roughly USD 5.8tn, while the combined market value of Solactive’s USD High Yield Corporate Bond Index is only USD1.3tn[1]
Aggregate Amount Oustanding
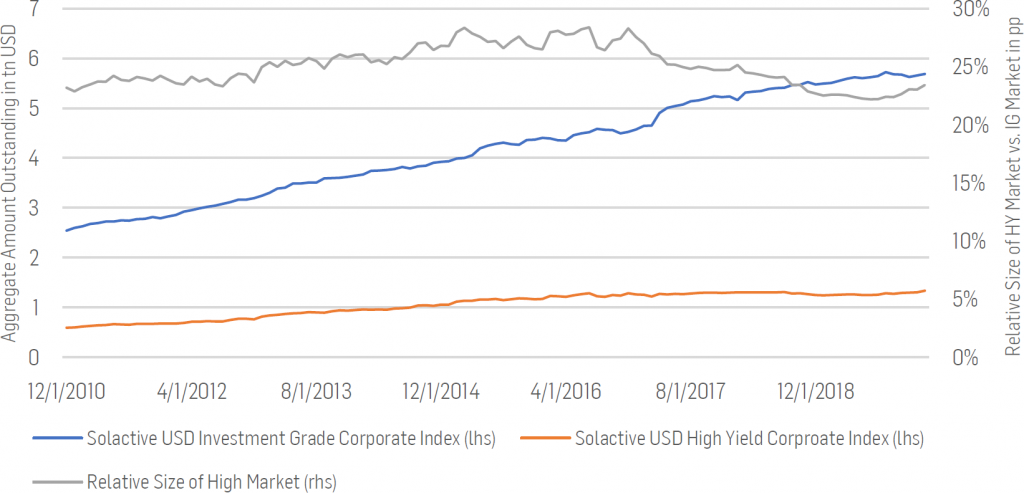
Figure 1: Size of USD Investment Grade and USD High Yield Market. The aggregate amount outstanding is taken as a proxy of market size. Source: Solactive AG
The remaining time to maturity and duration profile of the high yield universe is shorter compared to that of the investment-grade universe. While duration is a direct function of the timing of cash flows, this observation also has a technical reason as bonds in the high yield segment usually pay higher coupons. However, there is also evidence that high yield investors are not as comfortable with longer-term debt as investment grade investors due to the increased credit risk from high yield issuers. As of 27.03.2020, the average time to maturity of the Solactive USD Investment Grade Corporate Index was 11.60 years vs. 6.80 years of the Solactive USD High Yield Corporate Index[2].
Besides the size of the markets, they also differ in terms of the investor base. Often institutional investors such as pension funds, investment management divisions of insurance companies, or fund managers are prohibited to invest in bonds that are classified as high yield.
Why Fallen Angels
Fallen Angels describe corporate bonds issued by companies that recently lost their prestigious investment-grade rating and, thus, entered the high yield market. Recently there have been numerous well-known additions to the Fallen Angel segment, such as Ford Motor Company and Kraft Heinz[3].
While investing in fallen angels is riskier than investing in higher graded investment-grade bonds, it features some structural advantages, which can be exploited:
- Fallen Angel bonds face increased selling pressure by investors who are only allowed to hold investment-grade rated debt such as pension funds and investment funds, which are specialized in investment-grade corporate bonds.
- As the high yield market is smaller compared to the investment-grade market, there will be more sellers of Fallen Angels than potential buyers in the high yield space.
- Traditionally high yield investors are only comfortable with holding maturities of up to 10 years, while investment-grade bonds may be issued with maturities of up to 50 years. This note is another factor, which impacts the supply and demand function of fallen angels positively for a fallen angel investor.
How to invest in Fallen Angel bonds
Solactive has developed a rules-based and transparent strategy to invest specifically in fallen angel bonds and harvest the structural market benefits mentioned above. For a bond to be included, it first must pass a series of liquidity filters, such as a current amount outstanding of at least 400 million USD and minimum time to maturity of at least 1 year. All bonds eligible for the fallen angel strategy had to be rated as an investment-grade bond by Moody’s and S&P within the last three years and to be selected, either the current rating falls into the high yield category but not below BB-/Ba2, or the bond must have been upgraded into the investment-grade universe within the last 6 months.
This strategy shows promising results when being backtested, outperforming both the Solactive USD Investment Grade Corporate Index as well as the Solactive USD High Yield Corporate Index. While this strategy harvests structural return premia best, it is not useable from a practitioner’s point of view, as the monthly turnover reaches unacceptable levels. This strategy’s peak turnover occurs in August 2016 with a monthly two way turnover of approx. 95%.
To account for the investability of the strategy, we implement an additional turnover reduction mechanism, which only allows for the 20 most liquid bonds to be added each month. Using this methodology, we can mitigate the spike in turnover of the initial strategy in August 2016 from 95% to 36%. We find that this additional turnover reduction overlay does not impact performance distinctively.
In the chart below, we have plotted the Solactive USD Investment Grade Corporate Index, Solactive USD High Yield Corporate Index, Solactive USD Fallen Angel Index, and the Solactive USD Fallen Angel Investable Index.
Index Levels
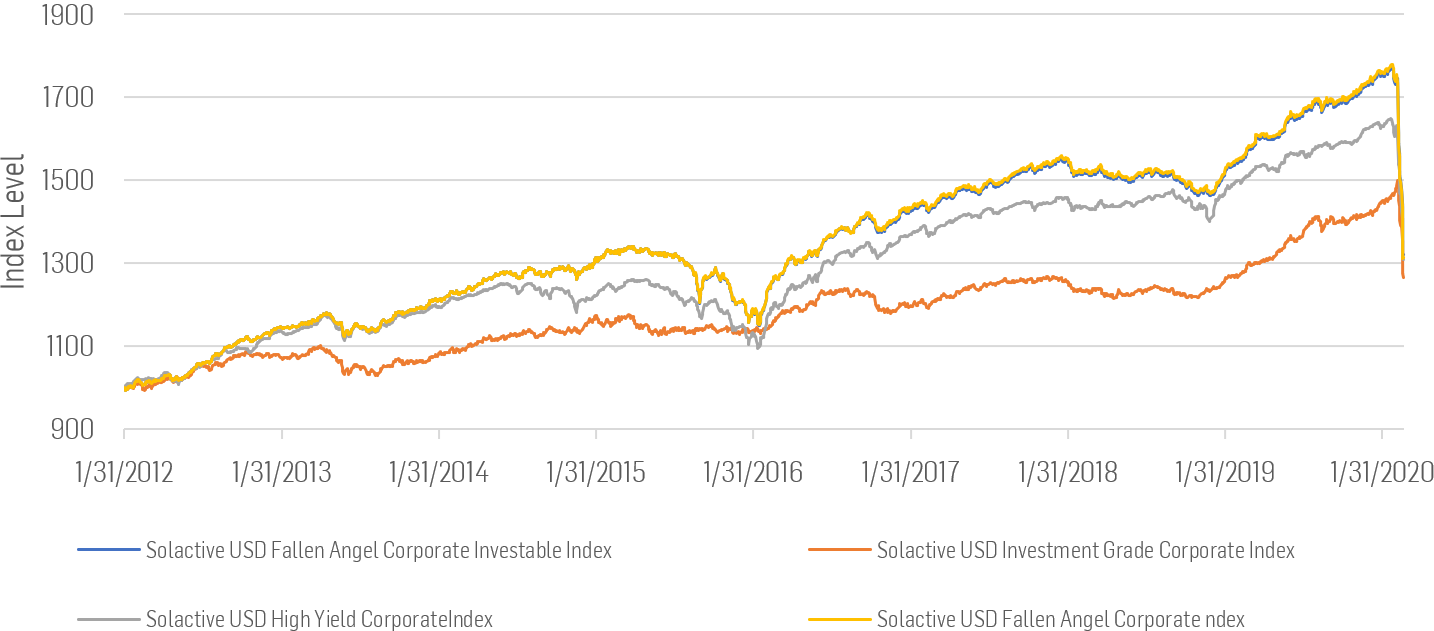
Figure 2: Backtested index performance of Solactive USD Fallen Angel Corporate Index vs. USD Investment Grade and USD High Yield indices. Re-index with index level on 31.12.2012 = 1000. Source: Solactive AG
Annualized returns of the Solactive USD Fallen Angel Corporate Investable Index were 3.59% p.a. vs. 3.02% p.a. for the Solactive USD Investment Grade Corporate Index and 3.42% p.a. of the Solactive USD High Yield Corporate Index. In one factor regression against the respective benchmarks, the Solactive USD Fallen Angel Corporate Investable Index achieves an annual alpha of 1.10% against the Investment Grade Benchmark and 0.3% against the High Yield Benchmark.
The credit risk exposure of the Solactive USD Fallen Angel Investable Index was near an all-time low as of 28.02.2020. As we expect the number of downgrades rising sharply, this figure will reverse in the upcoming month. It is still very interesting to observe how stable the average rating of the strategy has been within the last 8 years.
Solactive USD Fallen Angel Corporate Investable Index Rating
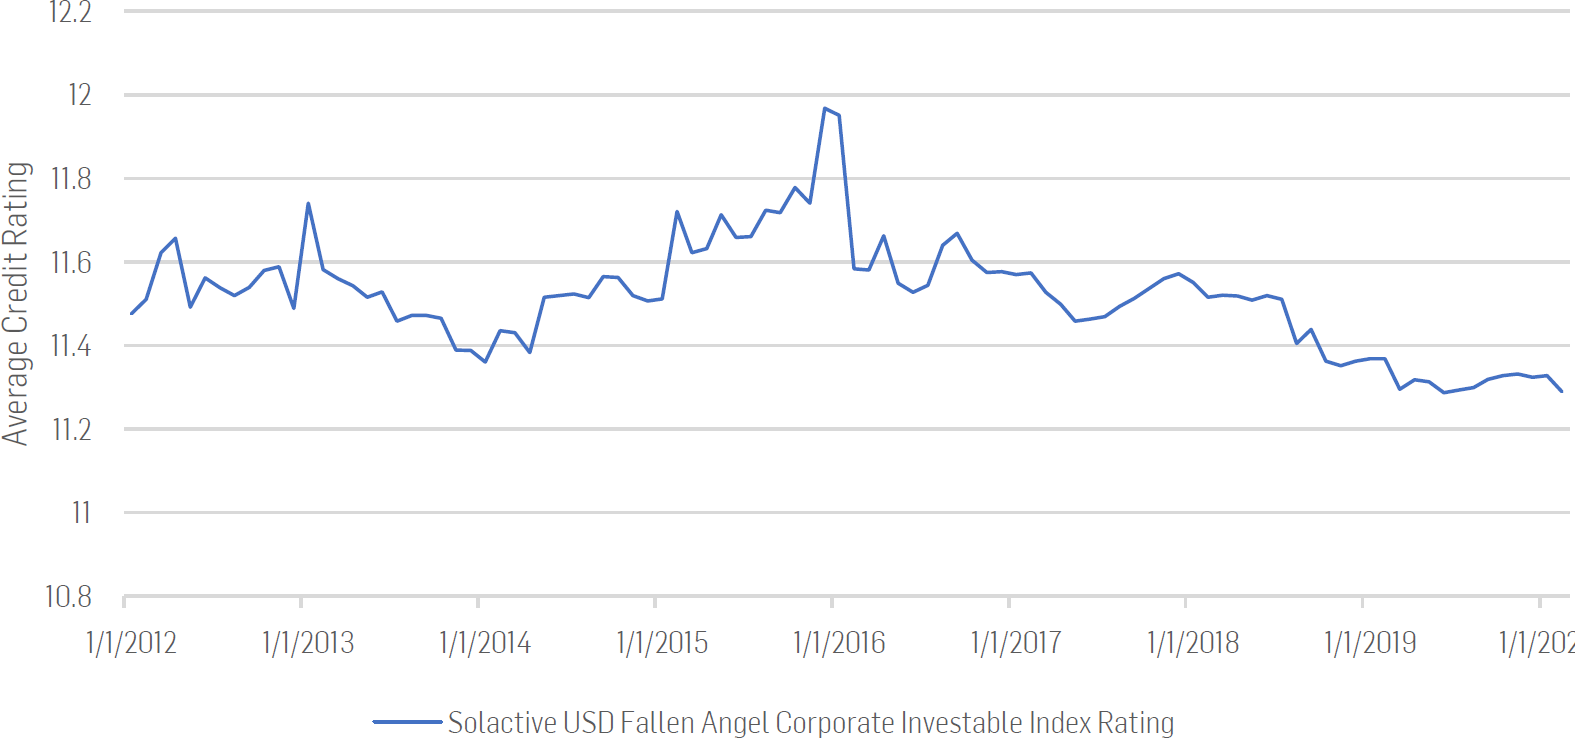
Figure 3: Average historic credit rating of the Solactive USD Fallen Angel Corporate Investable Index. The average rating per bond is calculated as the average numeric rating from Moody’s Investor Services, and S&P Global Ratings. Letter Ratings are mapped to numeric ratings using a linear scale, where AAA/Aaa1 equals 1. Source: Solactive AG
To test our main hypothesis, which states that fallen angel bonds can be purchased at relative discount prices, we compute the excess returns of hypothetical portfolios of only newly added bonds. Excess returns are calculated against our Solactive USD High Yield Corporate Index. Over our backtested period, we could form 72 of such portfolios, each including between 1 and 20 newly added bonds. Plotting the average cumulative excess returns we, find bonds perform best in the 40 days after their inclusion in the Solactive USD Fallen Angel Corporate Investable Index. We find similar results if we compare the returns of the hypothetical portfolios against the Solactive USD Investment Grade Corporate Index and the Solactive USD Fallen Angel Corporate Investable Index.
Cummulative Excess Returns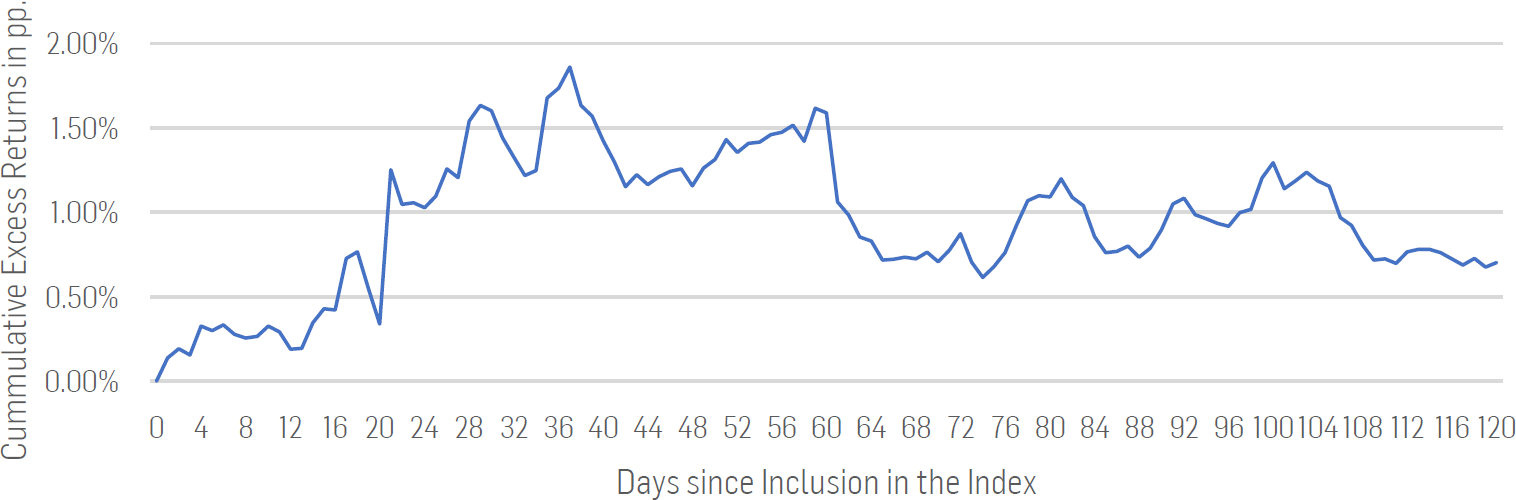
Figure 4: Excess Returns vs. Solactive High Yield Corporate Index. 72 portfolios were formed including only bonds which where newly included in to the Solactive USD Fallen Angel Corporate Investable Index. The performance of those portfolios was tracked for 120 days vs. the respective benchmark. Source: Solactive AG
Conclusion
Given the current economic outlook, we expect a Fallen Angel product in the credit markets to be very successful in the upcoming months. As the supply of Fallen Angel bonds will increase significantly, we will see elevated levels of forced selling from investment-grade funds and mandates. This behavior should lead to a further disconnection between observed prices and fundamental value in the BB+ to BB- credit rating spectrum, leading to buying opportunities in this segment of the fixed income market.
Sebastian Alber – Fixed Income Product Development
Solactive AG
References:
[1] Solactive AG, as of 27.03.2020
[2] Solactive AG, as of 27.03.2020
[3] Financial Times, ‘”Ford downgrade consigns $36bn of its debt into junk market”
https://www.ft.com/content/95035b47-f4ab-479e-a79c-2d0d981e658f