Volatility: Perception vs. Reality
A COGNITIVE DISSONANCE
At the beginning of 2018, the stock market crumbled. It soon began to recover throughout the year only to plunge again in Q4 like a lead balloon. Of course, this season left many investors with an unpleasant feeling behind, who were desperately searching for a scapegoat to pass the buck to. Psychology calls this mental phenomenon a cognitive dissonance, meaning that people, after they have made a wrongful decision, are actively looking for general excuses, which are, of course, out of their liability; especially in cases where their choice was proven to be wrong in the aftermath. The goat in this situation is called Volatility, which was branded as one of the main reasons to explain why portfolios did not perform as desired. “The year was very volatile. Therefore, we did not perform so well in 2018!” Dissonance resolved.
Of course, we have to be the killjoy and twist the knife:
CASE STUDY: 2018
Many investors considered 2018 to be a volatile year with massive swings to the downside. However, looking at the historical data provides a contrasting view when you look at standard deviations and average down days between 2007 and 2018.
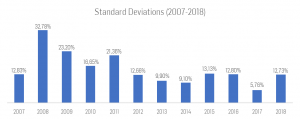
Graph 1: Standard Deviations for GBS Developed Markets LM TR (2007-2018)
As you can see above, 2018 wasn´t that much of an outlier. In 2018, the standard deviation of the Solactive GBS Developed Markets Large & Mid Cap Index TR (ISIN: DE000SLA41C4) was 12,73% compared to a mean of 15,24% between 2007 and 2018. Excluding the stock market crash of 2008 gives you an average standard deviation of 13,64% which is still above 2018 levels.
ROLLING IN THE DEEP
Graph 2 deals with another factor, which is the rolling 12-month performance. This chart highlights, at any given point, the 12-month performance compared to the exact date of the previous year. Unfortunately, the investment community only focuses on one fixed point to compare 12-month performance – and it is the 31st of December.
Most people, in contrast, invest at different points in time during a year and not on January 1st, rendering the rolling average a better representation of portfolio returns than the year-round performance.
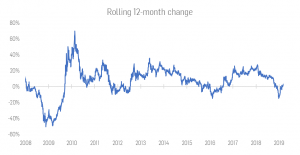
Graph 2: Rolling 12-month returns on GBS Developed Markets LM TR (2007-2019)
The graph shows that rolling 12-month returns remained positive throughout the entire year and only turned negative in December. During that time of the year, investment managers report their performance publicly. This disclosure obligation can lead to a false perception of downside performance.
Again, we can find evidence in social-psychology on why many investors revealed clouded reasoning through overweighting of volatility. The prospect theory by Kahneman and Tversky illustrates an S-shaped utility function for investors, which is steeper for losses, resulting in overweight of negative incidents compared to positive ones.[1] Looking at daily swings shows that they occurred less frequently, but in larger portions, leading to a higher perceived loss. Therefore, as described in the prospect theory, the perceived gain of a one percentage point’s increase is smaller than the perceived loss of the same movement downwards.
Now we want to look at the size of the down days in 2018. As shown in Graph 3, one cannot even consider the average down day in 2018 as extreme. It was -0,619% compared to an average of -0,709% (2007-2018).
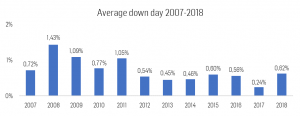
Graph 3: Average down days for GBS Developed Markets LM TR (2007-2018)
ANCHORING YOUR MIND
Kahneman and Tversky also discussed the anchoring bias in their popular paper on the prospect theory.[1] According to the anchoring bias, humans use an initial value as an anchor when making decisions and assess incoming information based on the anchor. Therefore, people make decisions on a relative and not absolute basis.
In financial markets, the previous year is used as an anchor. Performances, for example, are compared on an annual or year-to-date basis. The media amplifies this tendency, too. Thus, if we look at annual differences in returns, we may be able to identify the factors that led to the inaccurate overestimation of volatility in 2018.
As you can see in Graph 3, the average down day in 2017 was abnormally low at -0,24%. This value serves as an anchor to investors. When the average down day reversed to the mean in 2018, investors perceived it as a significant increase compared to the anchor.
AN APOLOGIA FOR VOLATILITY
Investors who want to protect themselves from the negative consequences of this bias, and even from the resulting cognitive dissonance, may be interested in low volatility indices. Solactive offers products for different regions to lower their (downside) volatility. The Solactive US High Dividend Low Volatility Index (ISIN: DE000SLA2DV9) or the Solactive European High Dividend Low Volatility Index (ISIN: DE000SLA0PB9) may be suitable options. On top, the Solactive All Country Minimum Downside Volatility Index (ISIN: DE000SLA3UZ2) limits only downside volatility and can improve the performance compared to the benchmark while reducing volatility at the same time.
Timo Pfeiffer
Head of Research & Business Development
[1] Kahneman & Tversky (1979)