Gold: Yielding After All
THE ZERO YIELD OF GOLD – SUDDENLY POSITIVE?!
Gold suddenly started yielding positively in relative terms in 2014. Back then, something yet unconsidered in many financial models happened on a non-negligible scale: Negative yields. The amount of outstanding debt yielding negatively had increased quite sharply until 2016. This trend paused afterwards and, recently, has once again gained steam. Compared to a lot of outstanding bonds, gold, therefore, shines brightly in a new light.
Nonetheless, the precious metal is not really an asset class. It neither pays dividends nor does it offer any yield to investors. Hence, it is impossible to calculate its “right price” from an underlying income stream or any rate projections.
DEMAND OF GOLD INCREASES IN UNCERTAINTY
There are admittedly plenty of possibilities to derive a value for gold from correlations to prices or yields of other asset classes, or from soft factors such as the risk perception of market participants. The latter could be based on economic policy uncertainty indices. The 60-day correlation between the Global Economic Policy Uncertainty Index and the gold price has recently increased to above 0.9. The rise in the uncertainty index helps to understand the demand for gold and the corresponding 13.6% price increase in gold (in USD) since the end of last year, that has led to a fresh six-year-high of its price.
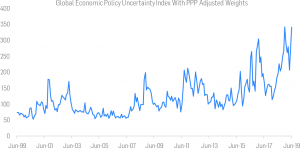
Figure 1: Index of economic policy uncertainty, Jun-99 until Jun-19. Source: Economic Policy Uncertainty, information on methodology: www.policyuncertainty.com/methodology.
THE MAJOR ROLE OF BONDS AND VANISHING OPPORTUNITY COSTS
Another explanation for gold’s demand boost could be the, currently low, opportunity costs of an investment in gold, with 10-year Bund and US-Treasury yields at -0.5% and 1.8%, respectively. According to Bloomberg, the global outstanding debt yielding negatively topped USD 14 trillion recently and thus has reached a new high-water mark at the beginning of August 2019. In the Solactive benchmark indices Solactive Broad Global Developed Government Bond TR EUR Index, and Solactive Euro IG Corporate Index, 392 out of 1063 bonds, and 809 out of 2660 bonds had a negative yield to maturity as of end-July 2019, respectively. The corresponding amounts in EUR-terms are 6.08 trillion for the government bond index, and 0.73 trillion for the corporate bond index. For the former, this meant that 29.4% of its outstanding debt had a negative yield, whereas this was the case for 31.8% of that of the latter. The current yield to maturity is 0.9% for the govies index with an average modified duration of 8.17, and 0.6% for the corporates index with a duration of 5.36. With indicators pointing towards a slowing global economic growth and dovish signals from central banks, a turning point is not in sight. From this perspective, the gold price will most likely stay well-positioned.
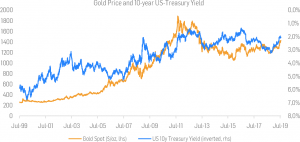
Figure 2: Gold Price and 10-year US-Treasury Yield, Jul-99 until Jul-19. Sources: FactSet, Solactive AG.
In this article, we focus on gold demand from investments, which stands at 1,165.3 tons or 26.5% of total demand in 2018, according to the World Gold Council. Other gold demand sectors are jewelry with 2,241.8 tons, technology with 334,8 tons, and central banks & other institutions with 656.9 tons. Remarkably, the latter’s gold demand has recently increased to its highest levels since around 50 years ago. The demand trend has continued during Q2 2019. Remarkably, not only the gold price but also the inflows in gold-backed ETFs have grown to a six-year high, according to the World Gold Council.
POSSIBILITIES TO INVEST IN GOLD
1. Direct investments
Even with the possibility of potential positive price movements of the metal, those investors aiming for a positive reoccurring yield have regarded gold as relatively unattractive throughout most of history. Nowadays, however, with a huge amount of outstanding debt yielding negatively, gold has become more appealing to investors. This is not only true from a real yield perspective but eventually explains its year-to-date performance. Compared to a negative expected rate of return, the zero-rate offered by gold becomes positive in relative terms after all. In other words, if the benchmark – e.g., for very defensive bond investors – provides negative rates, 0% may become a bang for their buck. In light of recent developments, the Solactive GLD EUR Gold Index, which increases in the price of gold and in USD-appreciation against the EUR, has returned 17.1% year-to-date. This index belongs to a Solactive index family of single currency gold indices. Another alternative is obviously to buy physical gold.
2. Buying gold-related stocks
Following the aforementioned line of argument, some investors have started buying the zero-rate of gold. For other investors, it is still entirely disregarded. However, the mainstream view on gold is to use it as a hedge or for diversification purposes due to its negative or low correlation with other actual asset classes. But if investors want to benefit from its price movements, they can do so by buying shares of companies that are active in the gold industry, e.g., miners. Under the assumption of fixed costs and constant output, such an investment is comparable to buying a call option on the gold price. With a price increase at above 10% year-to-date, several Solactive stock indices in the field have done very well. Among the best performing indices year-to-date is the Solactive Global Gold Mining Total Return Index (in EUR), with a return of 38.2% in 2019 thus far. The realized annualized volatility of the index consisting of 10 gold miners mainly from Canada, the United States, Australia, and South Africa is relatively low at 17.2%. The Solactive Equal Weight Global Gold Index with CAD-denomination and 30 index members has returned 38.1%, but with higher volatility. An index focusing on the price movements in shares of companies active in the gold mining industry as explorers or developers is the Solactive Global Gold Explorers & Developers Total Return Index. The index currency is USD and it contains 50 companies. Its year-to-date-performance has been comparable to that of the others at 33.6%. As small caps may be riskier than large caps, the Solactive Global Gold Giants Index TR tracks the performance of the 20 largest gold miners by market capitalization that are listed in North America, Australia, or in certain European countries. The CAD-denominated index realized comparably low volatility but lacks in terms of performance with a 21.8% return since the end of 2018.
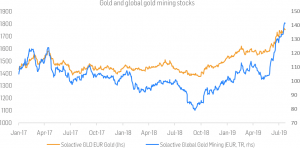
Figure 3: Comparison of a direct investment and a stock investment: Gold index and gold mining stocks index, Jan-2017 to Jul-2019. Source: Solactive AG.
| Performance, as of Aug-02, 2019 | |||
| YTD | 1 year | 5 years | |
| Gold price (USD/oz) | 13.6% | 16.2% | 10.6% |
| Solactive GLD EUR Gold Index (EUR) | 17.1% | 27.1% | 43.9% |
| Solactive Global Gold Mining TR Index (EUR) | 38.2% | 49.8% | 72.1% |
| Solactive Global Gold Explorers & Developers TR Index (USD) | 33.6% | 26.0% | – |
| Solactive Equal Weight Global Gold Index (CAD) | 38.1% | 37.7% | 21.6% |
| Solactive Global Gold Giants Index TR (CAD) | 21.8% | 27.5% | 36.1% |
Table 1: Performance overview. Readers should take currency fluctuations into consideration. Sources: FactSet, Solactive AG.
3. Covered Call Strategies:
An additional way of investing in the precious metal and even making gold yield an expected steady income is by selling call options while holding gold as collateral. This approach attempts to achieve an absolute return by benefiting from a price increase in gold – e.g., by holding a futures position in gold – and additionally selling call options on the futures. The premia collected from the sale of the options generate a steady income and act as downside protection against a downwards price movement in gold. In times of zero interest rates, this strategy aims to generate a regular expected flow of income, while at the same time enabling investors to participate in an appreciation in the gold price. The Solactive Covered Call Gold 3% OTM TR Index (USD) and the Solactive Covered Call Gold Target 5% Income TR Index (USD) have returned 2.6% and 2.2%, respectively, on an annualized basis over the past 5 years. Since the end of 2018, the indices have returned 9.6% and 6.6%, respectively.
| Performance, as of Aug-02, 2019 | |||
| YTD | 1 year | 5 years | |
| Solactive Covered Call Gold 3% OTM Total Return Index (USD) | 9.6% | 15.5% | 13.5% |
| Solactive Covered Call Gold Target 5% Income Total Return Index (USD) | 6.6% | 11.5% | 11.7% |
Table 2: Performance overview. Source: Solactive AG.
FINAL REMARKS
Gold has fascinated humankind throughout history. 51.0% of its total demand in 2018 came from jewelry, whilst central banks purchases rose to the highest level in decades. More relevant for investors are the correlations between the precious metal and uncertainty as well as yield levels. Gold is often seen as a parachute that protects investors from crises. In the light of low or negative interest rates, there is another reason to have exposure to it – either through physical purchases, passive index products, gold-related stocks, or through a covered call strategy. The recent upswing in gold and strong year-to-date performance of related indices appears justified, and given the current environment of political risk, low economic growth and low yields, a trend reversal may not be imminent. Despite the current support for gold, investors should keep in mind that an investment in gold basically is a bet on its price, and it won’t offer a payout during the holding period. But as long as gold demand remains high due to the reasons outlined above, it is worth watching the developments in the index- and ETF-world closely.
Dr. Axel Haus
Team Head Qualitative Research
Solactive AG